
Apps that take longer than 3 seconds to load lose up to 70% of first-time users. Yet most developers have no idea what their actual startup time is or how to measure it accurately.
Every developer has experienced this moment.
You tap an app… and nothing happens.
No UI. No feedback. Just a blank screen.
Three seconds later you’ve already assumed it’s frozen - and you close it.
Your users do exactly the same thing.
Startup performance isn’t a “nice-to-have metric.” It’s the first impression your product makes. If the first frame is slow, users don’t wait around to admire your architecture. They churn.
Even worse: Google factors startup performance heavily into Play Store visibility, and Apple rejects apps that exceed their launch time thresholds.
If your app is slow, you're losing users and discoverability.
This guide will teach you exactly how to measure startup performance on Android, iOS, and Flutter, using the same tools and techniques top apps use to maintain sub-2-second launch times.
First, understand what “startup” really means
Not every launch is the same. Sometimes the system has to create your process from scratch. Other times your app is already sitting in memory. These scenarios behave very differently, which is why measuring “launch time” without context is misleading.
A cold start - when the process doesn’t exist and the OS has to load your code, initialize the framework, and build your first screen is the slowest and most important case. It’s also the one users see the first time they open your app.
Warm and hot starts are faster, but they don’t matter if users abandon during the very first launch.
In practice, most mobile teams aim for a cold start under two seconds on mid-range devices. That’s not an official rule - just a threshold that consistently feels instant to humans.
Types of App Startup
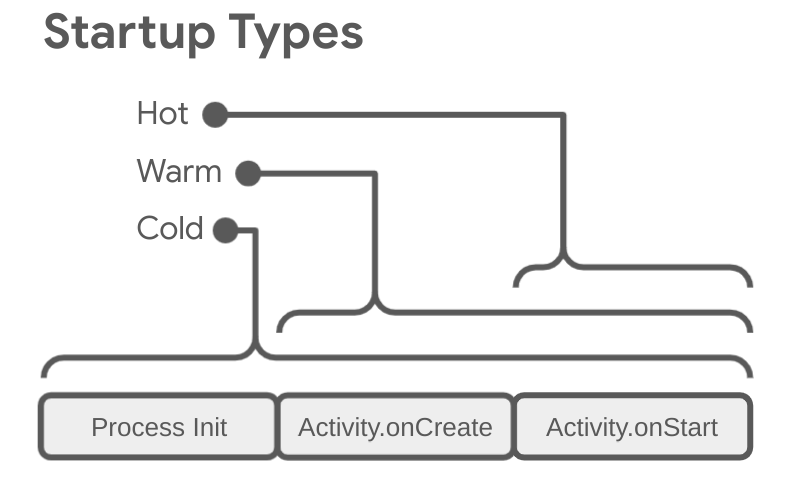
Understanding startup types is critical because each has different performance characteristics and thresholds.
| Type | What Happens | When It Occurs | Target Time |
|---|---|---|---|
| Cold Start | App process created from scratch. System loads code, initializes framework, creates main activity. | First launch after install, reboot, or process killed by system | < 2 seconds |
| Warm Start | Process exists but activity needs recreation. Faster than cold start. | Returning after extended background time | < 1 second |
| Hot Start | Activity brought to foreground. Minimal work required. | Switching back to an already-running app | < 500 ms |
Why cold start matters most: It's the first impression your app makes. Users won't wait around to see if warm starts are faster.
Why Startup Performance Matters
Startup time isn't just a vanity metric. It directly impacts your bottom line:
| Impact | Statistic |
|---|---|
| User Abandonment | 88% of users will abandon apps due to slow performance |
| Conversion Drop | Every 1-second delay causes a 7% drop in conversions |
| Uninstall Rate | Apps exceeding 6 seconds see a 33% higher uninstall rate |
| App Store Ranking | Google tracks startup times in Android Vitals and penalizes slow apps |
The data is clear: fast apps win. But before you can optimize, you need to measure.
Platform-Specific Thresholds
Google and Apple have clear expectations. Exceeding these hurts your app store ranking:
| Platform | Cold Start Threshold | Warm Start Threshold | Hot Start Threshold |
|---|---|---|---|
| Android (Google Vitals) | ≥ 5 seconds = "excessive" | ≥ 2 seconds = "excessive" | ≥ 1.5 seconds = "excessive" |
| iOS (Apple Guidelines) | First frame in < 400 ms (recommended) | < 1 second | < 500 ms |
| Flutter | < 2 seconds (recommended) | < 1 second | < 500 ms |
Sources: Android Developers - App Startup Time, Apple Developer - Improving App Responsiveness
How to Measure Startup Time
Key Metrics to Track
Before diving into tools, understand what you're measuring:
| Metric | Definition | Why It Matters |
|---|---|---|
| TTID (Time to Initial Display) | Time until first frame is rendered on screen | User perceives app as "responsive" |
| TTFD (Time to Full Display) | Time until app is fully interactive with all content loaded | User can actually use the app |
| Time to First Frame (TTFF) | Flutter-specific: time from engine start to first frame | Core metric for Flutter apps |
Rule of thumb: TTID should be < 2 seconds. TTFD should be < 4 seconds for content-heavy apps.
Measuring startup on Android
Method 1: Using Android Studio Logcat (Quick Check)
The simplest way to check startup time is via Logcat: If you build for Android, everything starts with Android Studio and the tools Google already ships.
The quickest sanity check is surprisingly simple. Launch your app and run:
# Run this in terminal while launching your app
adb logcat -d | grep "Displayed"
/Expected output:
Displayed com.yourapp/.MainActivity: +1s234msThis shows TTID (time to initial display). The +1s234ms means the first frame appeared 1.234 seconds after the app started.
Method 2: Android Vitals (Production Data)
For real-world performance data across thousands of users:
- Go to Google Play Console
- Navigate to Quality > Android Vitals > App startup time
- Review cold, warm, and hot start distributions
What to look for:
- 90th percentile cold start time (this is what slow devices experience)
- Percentage of sessions exceeding thresholds
- Trends over app versions
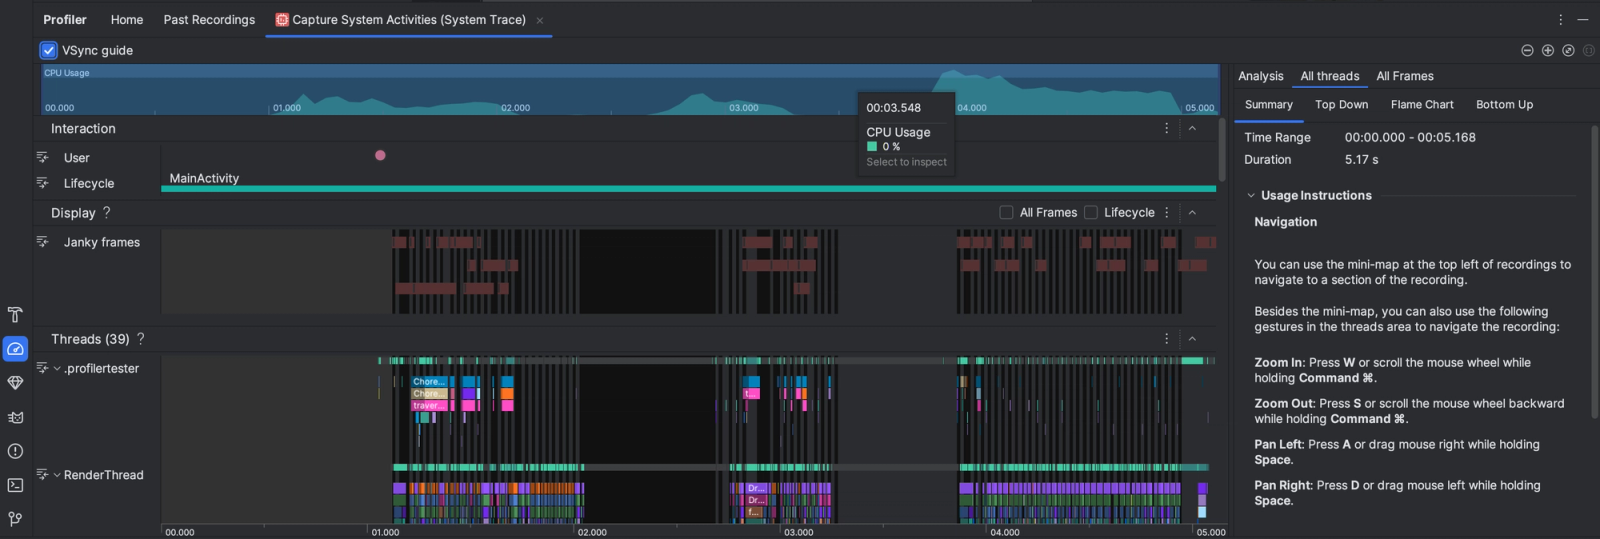
Once you need deeper insight - like figuring out exactly what’s blocking the main thread - switch to Perfetto. It records a full system trace so you can literally see class loading, content providers, and expensive initializers slowing things down.
Method 3: Perfetto Trace (Deep Analysis)
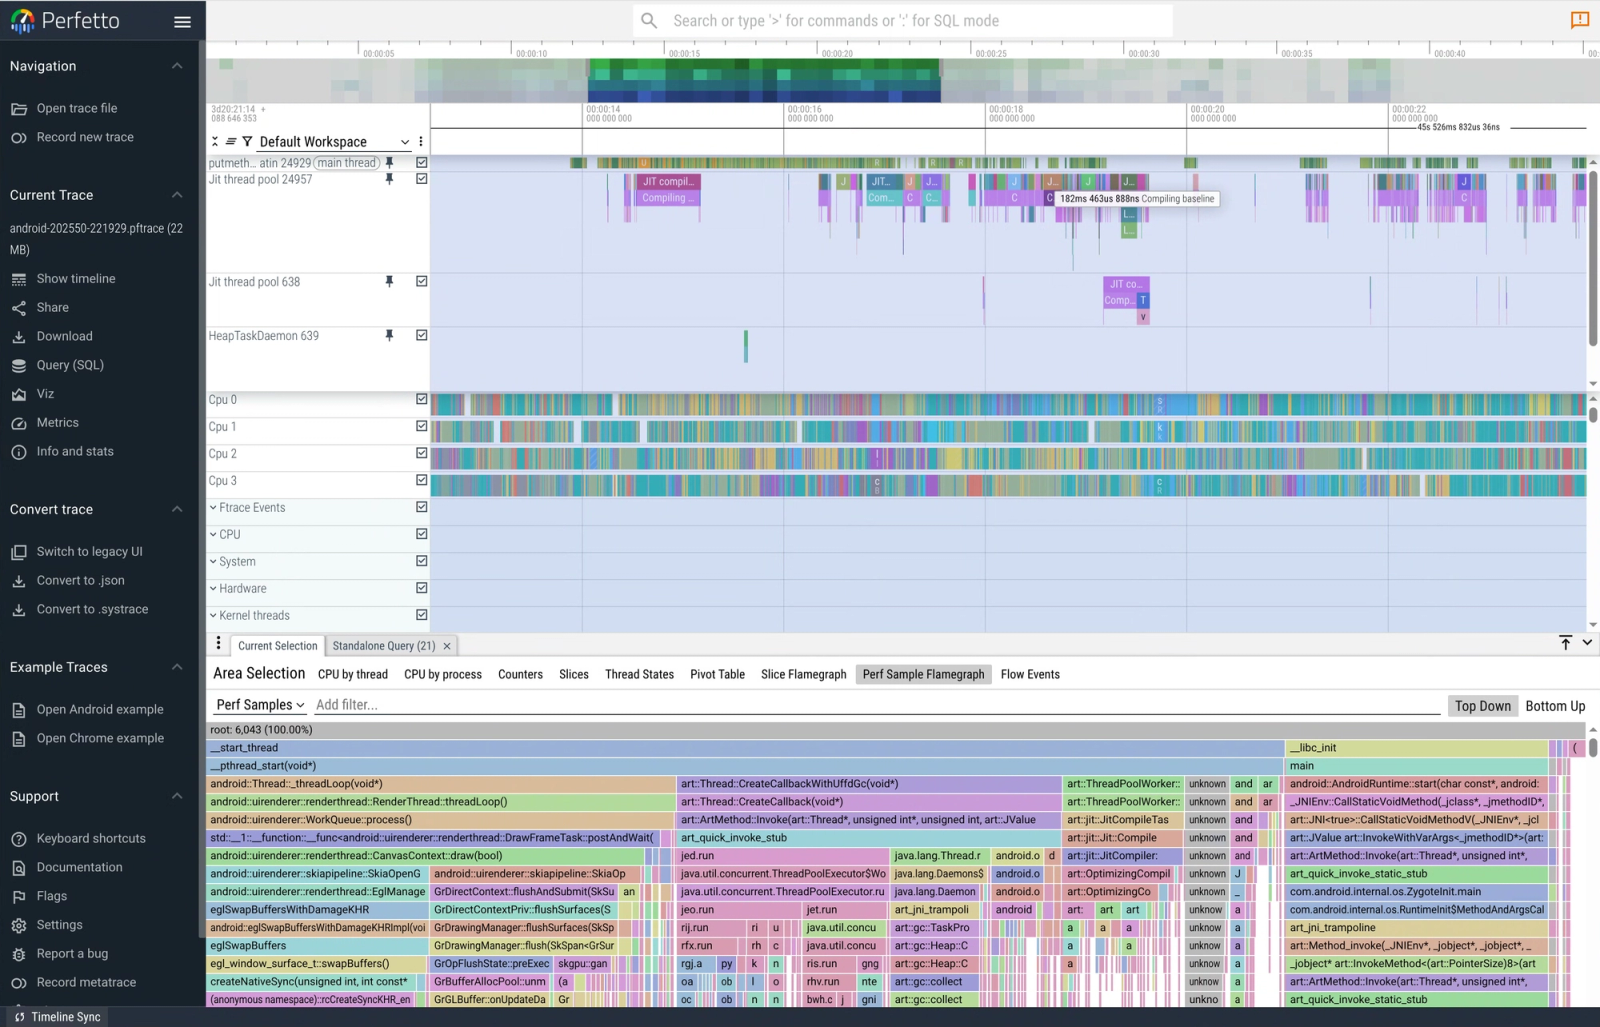
For identifying exactly what is slow:
# Start a perfetto trace
adb shell perfetto \\
  -c - --txt \\
  -o /data/misc/perfetto-traces/trace \\
<<EOF
buffers: {
    size_kb: 8960
    fill_policy: DISCARD
}
data_sources: {
    config {
        name: "linux.process_stats"
        target_buffer: 0
        process_stats_config {
            scan_all_processes_on_start: true
        }
    }
}
duration_ms: 10000
EOF

# Launch your app
adb shell am start -W -n com.yourapp/.MainActivity

# Pull the trace
adb pull /data/misc/perfetto-traces/trace trace.perfetto
Open the trace at ui.perfetto.dev to visualize exactly what's happening during startup.
Method 4: Programmatic Measurement
Add this to your MainActivity to log startup time:
// MainActivity.kt
class MainActivity:AppCompatActivity(){

overridefunonCreate(savedInstanceState: Bundle?){
super.onCreate(savedInstanceState)
setContentView(R.layout.activity_main)

// Report when app is fully drawn
        window.decorView.post{
val startupTime= System.currentTimeMillis()- processStartTime
            Log.d("StartupTime","TTID:${startupTime}ms")

// For Android 10+
if(Build.VERSION.SDK_INT>= Build.VERSION_CODES.Q){
reportFullyDrawn()
		}
	}
}

companionobject{
privateval processStartTime= System.currentTimeMillis()
	}
}
Making Android startup faster
Once you measure, patterns appear quickly. The biggest mistake most apps make is doing too much work before the first frame.
Analytics setup, Remote config fetches, Database migrations, Crash SDKs. All blocking the main thread while the user stares at a blank screen.
The fix is simple: show UI first, initialize later.
Modern apps often use Jetpack App Startup to control which components load eagerly and which can be deferred. Moving just a few initializers can cut hundreds of milliseconds instantly.
class AnalyticsInitializer : Initializer<Analytics> {
override fun create(context: Context): Analytics {
return Analytics.init(context)
}
override fun dependencies() = emptyList<Class<out Initializer<*>>>
()
}
Avoid main-thread work
Common mistakes:
- disk IO
- JSON parsing
- DB setup
- Network calls
Anything >4ms risks frame drops.
You’ll also see big wins from reducing APK size, enabling R8, and generating Baseline Profiles so Android can precompile hot paths ahead of time.
Reduce dex/class loading
- remove unused libraries
- enable R8
- split features
Smaller app = faster cold start.
Defer heavy initialization
Move non-critical work out of Application.onCreate().
Bad:
Analytics.init()
CrashReporting.init()
Database.migrate()
Good:
Handler(Looper.getMainLooper()).post {
   Analytics.init()
   CrashReporting.init()
}
Why use Handler here?
On Android, the main (UI) thread processes tasks one by one during startup. If you initialize analytics, crash reporting, or databases inside onCreate(), they run before the first frame draws, which directly delays launch.
Handler(Looper.getMainLooper()).post { ... } simply says:
“Run this after the current startup work finishes.”
So the sequence becomes:
- draw first frame
- show UI to user
- then initialize SDKs
The work still happens - just after the screen is visible, which improves perceived startup time.
Important: this doesn’t create a background thread. It only defers small, non-critical tasks. Heavy work should still move to IO/background threads.
Cold start performance is mostly about one principle: do less work before drawing the first frame.
Measuring startup on iOS
On iOS, measurement lives inside Xcode.
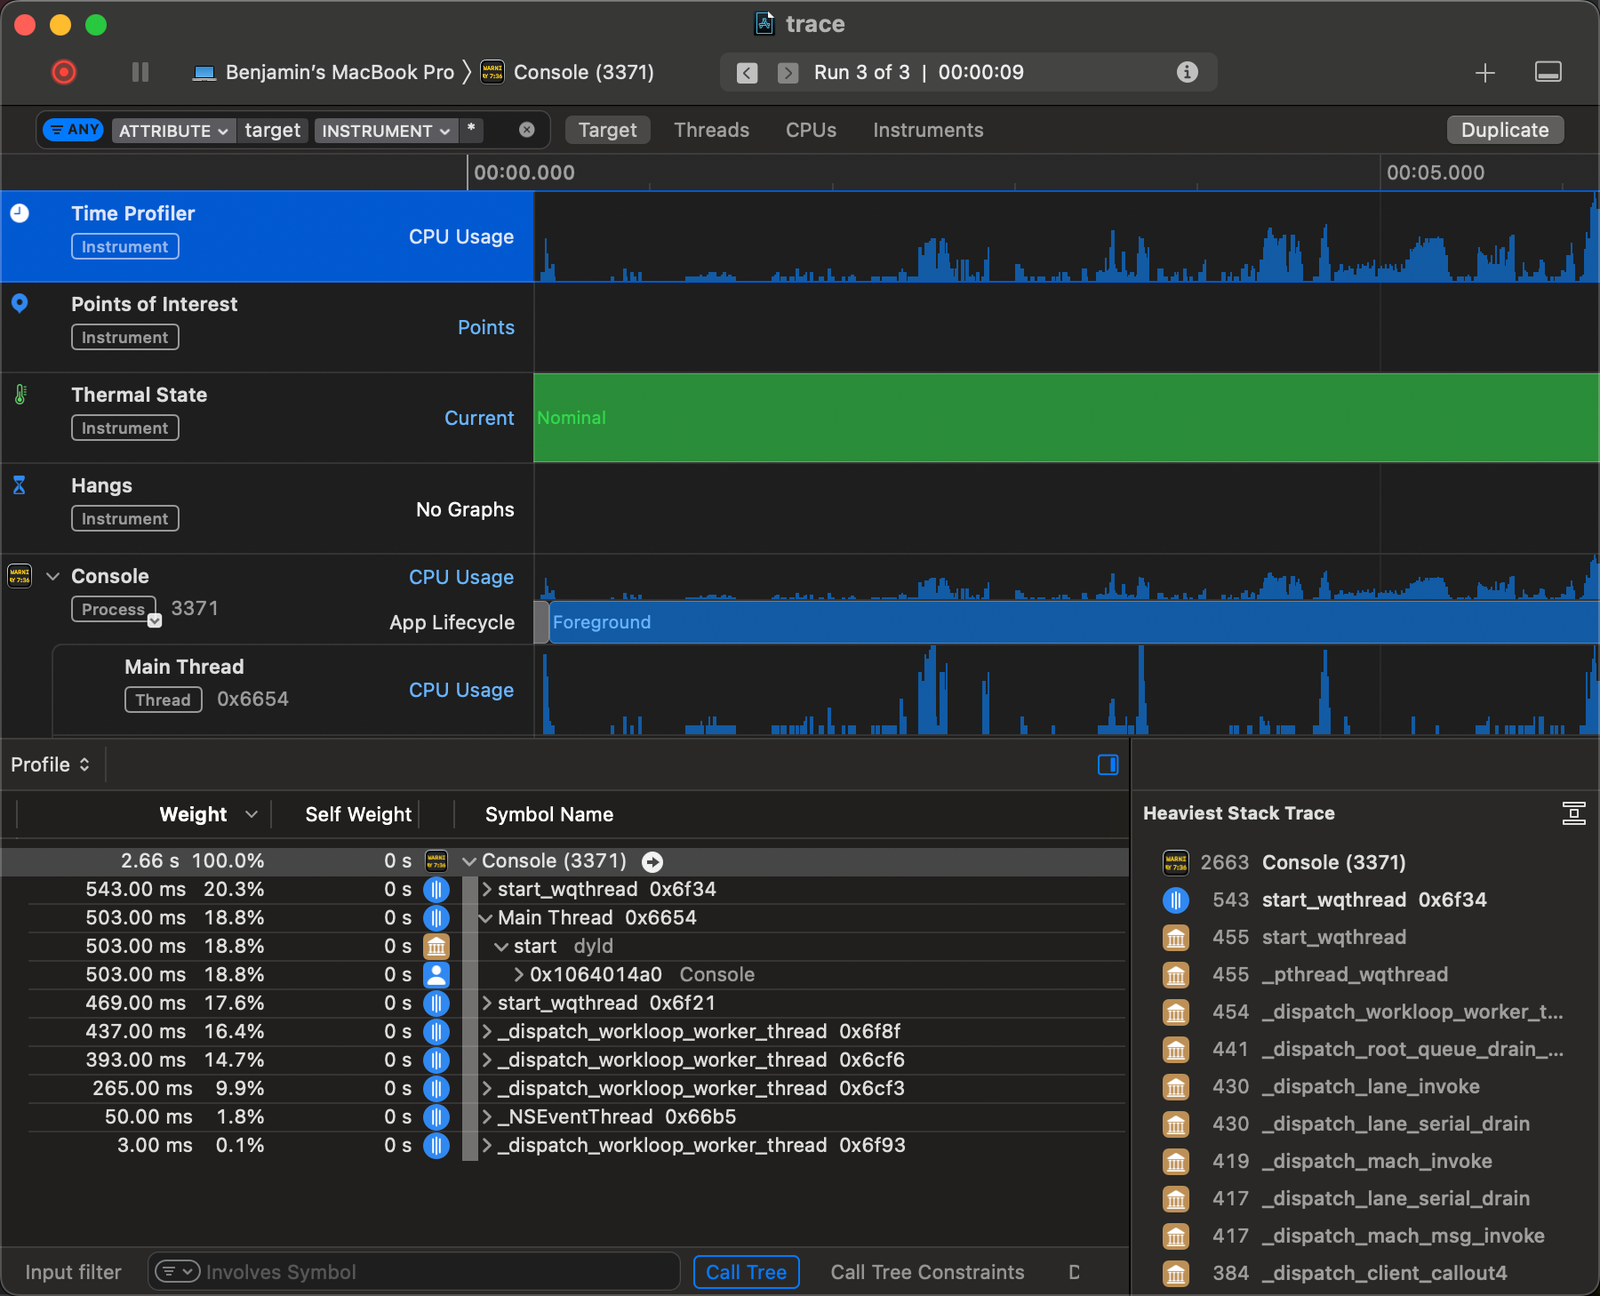
Method 1: Xcode Time Profiler
- Open your project in Xcode
- Go to Product > Profile (or ⌘+I)
- Select Time Profiler
- Click Record, then launch your app
- Look for the UIApplicationMain to viewDidAppear span
Method 2: Adding Pre-Main Time Logging
Add this environment variable in your scheme to see pre-main time:
- Product > Scheme > Edit Scheme
- Under Run > Arguments > Environment Variables, add:
- DYLD_PRINT_STATISTICS = 1
Output example:
Total pre-main time: 1.2 seconds (100.0%)
         dylib loading time: 800.0 milliseconds (66.6%)
        rebase/binding time: 100.0 milliseconds (8.3%)
            ObjC setup time:  50.0 milliseconds (4.1%)
           initializer time: 250.0 milliseconds (20.8%)
Method 3: Programmatic Measurement
// AppDelegate.swift or App.swift
importFoundation

@main
structMyApp:App{
init(){
// Mark launch start time (do this as early as possible)
LaunchTimeTracker.shared.markStart()
}

var body:someScene{
WindowGroup{
ContentView()
.onAppear{
LaunchTimeTracker.shared.markEnd()
			}
		}
	}
}

classLaunchTimeTracker{
staticlet shared=LaunchTimeTracker()

privatevar startTime:CFAbsoluteTime=0

funcmarkStart(){
        startTime=CFAbsoluteTimeGetCurrent()
}

funcmarkEnd(){
let launchTime=(CFAbsoluteTimeGetCurrent()- startTime)*1000
print("📱 App launch time:\\(String(format:"%.2f", launchTime))ms")

// Send to analytics
Analytics.track("app_launch_time", properties:["duration_ms": launchTime])
	}
}
Method 4: MetricKit
For iOS 13+, use MetricKit to collect startup data from real users:
importMetricKit

classMetricManager:NSObject,MXMetricManagerSubscriber{
funcdidReceive(_ payloads:[MXMetricPayload]){
for payloadin payloads{
iflet launchMetrics= payload.applicationLaunchMetrics{
let coldLaunch= launchMetrics.histogrammedTimeToFirstDraw
.bucketEnumerator.allObjects
print("Cold launch histogram:\\(coldLaunch)")
			}
		}
	}
}
Making iOS startup faster
The same principle applies here: do less work up front.
Heavy logic inside AppDelegate, global singletons that initialize on load, or dozens of dynamic frameworks all add invisible delay before the first frame appears.
Cutting dependencies, lazy-loading features, and rendering a lightweight first screen before loading content often reduces startup time more than any micro-optimization ever will.
Avoid work in AppDelegate / init
Bad:
Analytics.start()
Database.setup()
RemoteConfig.fetch()
Better:
DispatchQueue.main.async {
   Analytics.start()
}
or defer until first screen appears.
Why use DispatchQueue.main.async here?
On iOS, everything during launch runs on the main thread. If you start analytics, databases, or SDK setup inside AppDelegate or didFinishLaunching, that work blocks the thread before the first screen appears, increasing startup time.
DispatchQueue.main.async {
   Analytics.start()
}
This simply defers the work to the next run loop cycle.
So the order becomes:
- render first screen
- UI becomes visible
- then analytics initializes
Nothing magical - you’re just letting the first frame render first.
Important: this still runs on the main thread, so only defer lightweight setup. Heavy work should move to background queues.
Remember: users don’t care if data loads 200ms later. They care if nothing appears at all.
Flutter: Step-by-Step Measurement
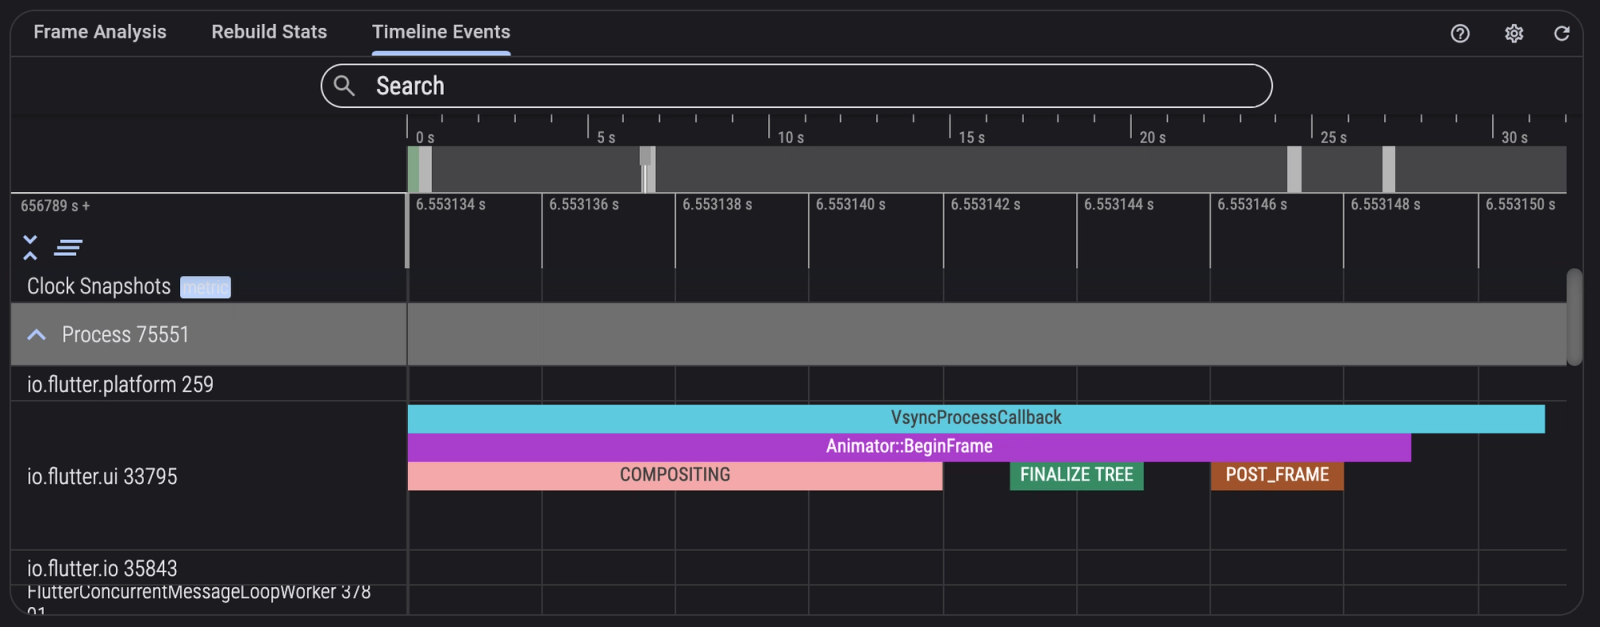
Method 1: Flutter DevTools Timeline
- Run your app in profile mode:
flutter run --profile- Open Flutter DevTools (the URL appears in terminal)
- Go to the Timeline tab
- Look for these key spans:
- Framework initialization
- First useful frame
- Build widgets
Method 2: Programmatic Measurement
Add this to your main.dart:
// main.dart
import 'dart:developer' as developer;

void main() {
  // Start timing immediately
  final startTime = DateTime.now();

  WidgetsFlutterBinding.ensureInitialized();

  runApp(MyApp(startTime: startTime));
}

class MyApp extends StatelessWidget {
  final DateTime startTime;

  const MyApp({super.key, required this.startTime});

  @override
  Widget build(BuildContext context) {
    return MaterialApp(
      home: StartupMeasurer(
        startTime: startTime,
        child: const HomePage(),
      ),
    );
  }
}

class StartupMeasurer extends StatefulWidget {
  final DateTime startTime;
  final Widget child;

  const StartupMeasurer({
    super.key,
    required this.startTime,
    required this.child,
  });

  @override
  State<StartupMeasurer> createState() => _StartupMeasurerState();
}

class _StartupMeasurerState extends State<StartupMeasurer> {
  @override
  void initState() {
    super.initState();

    // Measure after first frame
    WidgetsBinding.instance.addPostFrameCallback((_) {
      final launchDuration = DateTime.now().difference(widget.startTime);

      developer.log(
        'App startup: ${launchDuration.inMilliseconds}ms',
        name: 'Startup',
      );

      // Send to analytics
      Analytics.logEvent('app_startup', {
        'duration_ms': launchDuration.inMilliseconds,
      });
    });
  }

  @override
  Widget build(BuildContext context) => widget.child;
}
Method 3: Firebase Performance Monitoring
For production data across many devices:
// pubspec.yaml
dependencies:
  firebase_performance: ^0.9.0

// main.dart
import 'package:firebase_performance/firebase_performance.dart';

void main() async {
  WidgetsFlutterBinding.ensureInitialized();

  final trace = FirebasePerformance.instance.newTrace('app_cold_start');
  await trace.start();

  await Firebase.initializeApp();

  runApp(MyApp(startupTrace: trace));
}

class MyApp extends StatelessWidget {
  final Trace startupTrace;

  const MyApp({super.key, required this.startupTrace});

  @override
  Widget build(BuildContext context) {
    return MaterialApp(
      home: Builder(
        builder: (context) {
          // Stop trace after first build
          WidgetsBinding.instance.addPostFrameCallback((_) {
            startupTrace.stop();
          });
          return const HomePage();
        },
      ),
    );
  }
}
Method 4: Startup Tracing (CI/CD Integration)
Run this command to get detailed startup metrics:
# Generate startup trace
flutter run --profile --trace-startup

# The trace is saved to build/start_up_info.json
cat build/start_up_info.json
Example output:
{
"engineEnterTimestampMicros":1234567890,
"timeToFirstFrameMicros":1845000,
"timeToFrameworkInitMicros":245000
}
Use this in CI to catch performance regressions:
# .github/workflows/perf.yml
-name: Check Startup Time
run:|
    flutter run --profile --trace-startup -d linux
    STARTUP_MS=$(jq '.timeToFirstFrameMicros / 1000' build/start_up_info.json)
    if (( $(echo "$STARTUP_MS > 2000" | bc -l) )); then
      echo "Startup time ${STARTUP_MS}ms exceeds 2000ms threshold"
      exit 1
    fi
    echo "Startup time: ${STARTUP_MS}ms"
Common Measurement Pitfalls
Avoid these mistakes that lead to inaccurate measurements:
| Pitfall | Why It's Wrong | What To Do Instead |
|---|---|---|
| Measuring on emulator only | Emulators don't reflect real device performance | Always test on real devices, especially low-end ones |
| Measuring in debug mode | Debug builds are 10-50x slower than release | Use --profile or --release flags |
| Testing only on WiFi | Network conditions affect startup for apps that fetch data | Test on 3G/4G and offline |
| Ignoring first run | First cold start includes additional setup (shader compilation, cache generation) | Measure both first-run and subsequent cold starts |
| Not testing on low-end devices | Your iPhone 15 Pro isn't representative | Test on devices 2-3 generations old |
| Measuring once | Startup times vary between runs | Take median of at least 5 measurements |
Quick Optimization Wins For Flutter
After measuring, here are the highest-impact optimizations:
1. Defer Non-Critical Initialization
Before (slow):
void main() async {
  WidgetsFlutterBinding.ensureInitialized();
  await Analytics.init();           // Blocks startup
  await CrashReporting.init();      // Blocks startup
  await RemoteConfig.fetchAll();    // Blocks startup
  runApp(MyApp());
}
After (fast):
void main() {
  WidgetsFlutterBinding.ensureInitialized();
  runApp(MyApp());

  // Initialize after first frame
  WidgetsBinding.instance.addPostFrameCallback((_) {
    Analytics.init();
    CrashReporting.init();
    RemoteConfig.fetchAll();
  });
}
Why use addPostFrameCallback here?
In Flutter, everything inside main() runs before the first frame is rendered. If you initialize analytics, crash reporting, or remote config there, Flutter must finish that work before showing anything on screen - which directly slows cold start.
This tells Flutter:
“Run this after the first frame is drawn.”
So the sequence becomes:
- render first screen
- user sees UI immediately
- then initialize SDKs
Same total work - just moved after first paint, which improves perceived startup time.
Important: this still runs on the main isolate, so only defer lightweight setup. Heavy tasks should go to background isolates or async work.
2. Use Const Widgets
// Bad: Creates new instance every rebuild
child: Text('Hello')

// Good: Reuses same instance
child: const Text('Hello')
3. Implement a Native Splash Screen
A lightweight native splash screen (logo on solid background) displays instantly while Flutter initializes. Use flutter_native_splash.
4. Lazy Load Heavy Features
// Use deferred imports for large features
import 'package:myapp/features/reports/reports.dart' deferred as reports;

// Load only when needed
Future<void> openReports() async {
  await reports.loadLibrary();
  navigator.push(reports.ReportsPage());
}
5. Reduce App Size
Apps over 50 MB see 25% higher abandonment. Use:
- flutter build --split-debug-info
- Compress images to WebP
- Remove unused packages
Shader warmup (first-run jank fix)
Flutter compiles shaders on first run, which can stall startup.
Use:
flutter run--profile--cache-sksland bundle the shaders.
This removes first-launch stutter on many devices.
Establishing a Performance Baseline
To track improvements and catch regressions:
Step 1: Define Your Baseline
Measure startup time on:
- High-end device (iPhone 14/Pixel 7)
- Mid-range device (iPhone SE/Pixel 4a)
- Low-end device (oldest supported)
Step 2: Document Your Thresholds
| Device Class | Cold Start Target | Alert Threshold |
|---|---|---|
| High-end | < 1.5s | > 2.0s |
| Mid-range | < 2.0s | > 2.5s |
| Low-end | < 3.0s | > 4.0s |
Step 3: Automate Monitoring
Add startup time to your analytics dashboard and set up alerts for regressions.
Quick-Start Checklist
Use this checklist to measure and improve your app's startup performance:
- Identify your current cold start time using one of the methods above
- Set a target based on platform thresholds (< 2s for cold start)
- Test on real devices (not just emulators)
- Measure in profile/release mode (not debug)
- Check the 90th percentile in production (via Android Vitals, MetricKit, or Firebase)
- Defer non-critical initialization to after the first frame
- Add startup time to your CI pipeline to catch regressions early
- Monitor trends over time via your analytics dashboard
How SDUI architecture improves startup performance
Up to this point, we’ve focused on tactical improvements: deferring SDKs, trimming dependencies, profiling traces, and moving work off the main thread.
Those optimizations help, but they treat individual bottlenecks.
There’s also a broader, architectural question worth asking: How much code does your app actually need to ship and initialize on day one?
Because startup time scales with how much work the runtime must do before the first frame appears.
More features typically mean:
- more classes
- more libraries
- more initialization
- more memory pressure
- longer cold starts
Even well-optimized code slows down if there’s simply too much of it.
This is where architectural patterns like Server-Driven UI (SDUI) come into play.
What SDUI changes
With SDUI, the app doesn’t bundle every screen layout and flow directly in the binary. Instead, the client ships a small rendering runtime and receives screen structure from the server at runtime.
In other words:
Traditional approach
→ bundle every screen and feature inside the app
SDUI approach
→ ship a UI engine + fetch screen definitions dynamically
That changes when work happens. Less work is required at launch because the client doesn’t need to eagerly initialize every possible screen or feature.
Does SDUI reduce app size?
Not automatically - and this nuance matters.
An SDUI solution including Digia or any similar system introduces:
- a runtime/SDK
- rendering logic
- schema handling
So your binary may actually get slightly larger at first.
However, as apps grow, SDUI can offset that cost because:
- fewer hardcoded screens ship in the bundle
- ewer feature modules initialize at startup
- experiments don’t require bundling additional UI code
- removed features don’t leave dead weight behind
So the trade-off looks like:
small app → SDK overhead might slightly increase size
large app → dynamic screens often reduce overall weight
The benefit is less about raw APK/IPA size and more about reducing eager initialization work. And startup time mostly depends on initialization, not just megabytes.
You can go and know more about how you can integrate DigiaUI and make your app Server Driven here.
Why this can help startup specifically
Cold start is dominated by three things:
- loading code into memory
- initializing dependencies
- constructing the first screen
SDUI doesn’t magically eliminate these, but it often reduces how much must happen before first paint.
For example:
- only the rendering engine loads at launch
- feature logic initializes when navigated to
- screens can start as lightweight shells
So the first frame can appear with less upfront work. That’s the real advantage: deferring feature cost, not shrinking bytes.
Where this fits practically
Think of it like this: Measurement tells you what’s slow, Optimization removes immediate waste, Architecture limits how much waste can exist in the first place.
SDUI is an architectural choice that can make startup performance easier to maintain over time, especially for large, fast-moving apps with many experiments and dynamic content.
It’s not a silver bullet, and it doesn’t replace platform-level best practices. You still need to profile, defer work, and minimize main-thread load.
But it can reduce how much code needs to participate in startup at all - which indirectly helps launch time as apps scale.
Further Reading
Official Documentation
- Android: App Startup Time - Google's authoritative guide
- iOS: Improving App Responsiveness - Apple's app launch guidelines
- Flutter: Performance Best Practices - Flutter team recommendations
Tools
- Perfetto - Trace visualization for Android
- Flutter DevTools - Timeline and performance analysis
- Firebase Performance - Cross-platform production monitoring
Deep Dives
- Jetpack App Startup Library - Optimize Android initialization
- WWDC: Improving App Launch Time - Apple's deep dive on iOS launch
Summary
Startup performance directly impacts user retention, conversion rates, and app store visibility.
Here's what you need to remember:
- Cold start under 2 seconds is the gold standard
- Measure on real devices in release/profile mode
- Monitor the 90th percentile in production, not just averages
- Defer non-critical work to after the first frame
- Automate regression detection in your CI/CD pipeline
The fastest apps don't just happen - they're measured, monitored, and continuously optimized. Now you have the tools to join them.