
Startup performance creates the first impression. Runtime smoothness determines how the app feels in the first few minutes. Screen load performance decides how quickly users can begin interacting.
But there is a fourth dimension of performance that rarely shows up in demos.
It is not about how fast the app begins. It is about how well it survives.
To understand this, imagine taking a car on a long highway drive. At the start, everything feels perfect. The engine starts instantly. The steering is light. Acceleration is smooth. You trust the machine.
Two hours later, the engine temperature rises. The steering feels heavier. Warning lights begin to flicker.
Eventually, the car stalls.
Nothing was wrong at the beginning.
The problem appeared under sustained load.
That is how long-term performance issues behave in mobile apps.
They are not first-minute problems.
They are endurance problems.
Memory Leaks: The Weight That Slowly Builds
Imagine that at every rest stop on your road trip, you place a small bag in the trunk. You never remove any. You just keep adding.
The car still moves, but gradually it becomes heavier. Acceleration slows. Fuel consumption increases. The engine works harder than it should.
A memory leak behaves the same way.
Technically, a leak occurs when objects that should be garbage collected remain strongly referenced. The heap grows steadily. Garbage collection runs more often. Eventually, the system throws an OutOfMemoryError or terminates the process.
Memory should fluctuate. It should not trend upward indefinitely.
Over time, this results in:
- Increasing memory footprint
- More frequent garbage collection cycles
- Longer GC pause durations
- Higher probability of OutOfMemory (OOM) crashes
From an engineering dashboard, it appears as gradual heap growth. From the user’s perspective, it appears as instability after prolonged usage, sudden slowdowns, or unexpected crashes.
Leaks are cumulative. They reveal themselves over duration, not instantly.
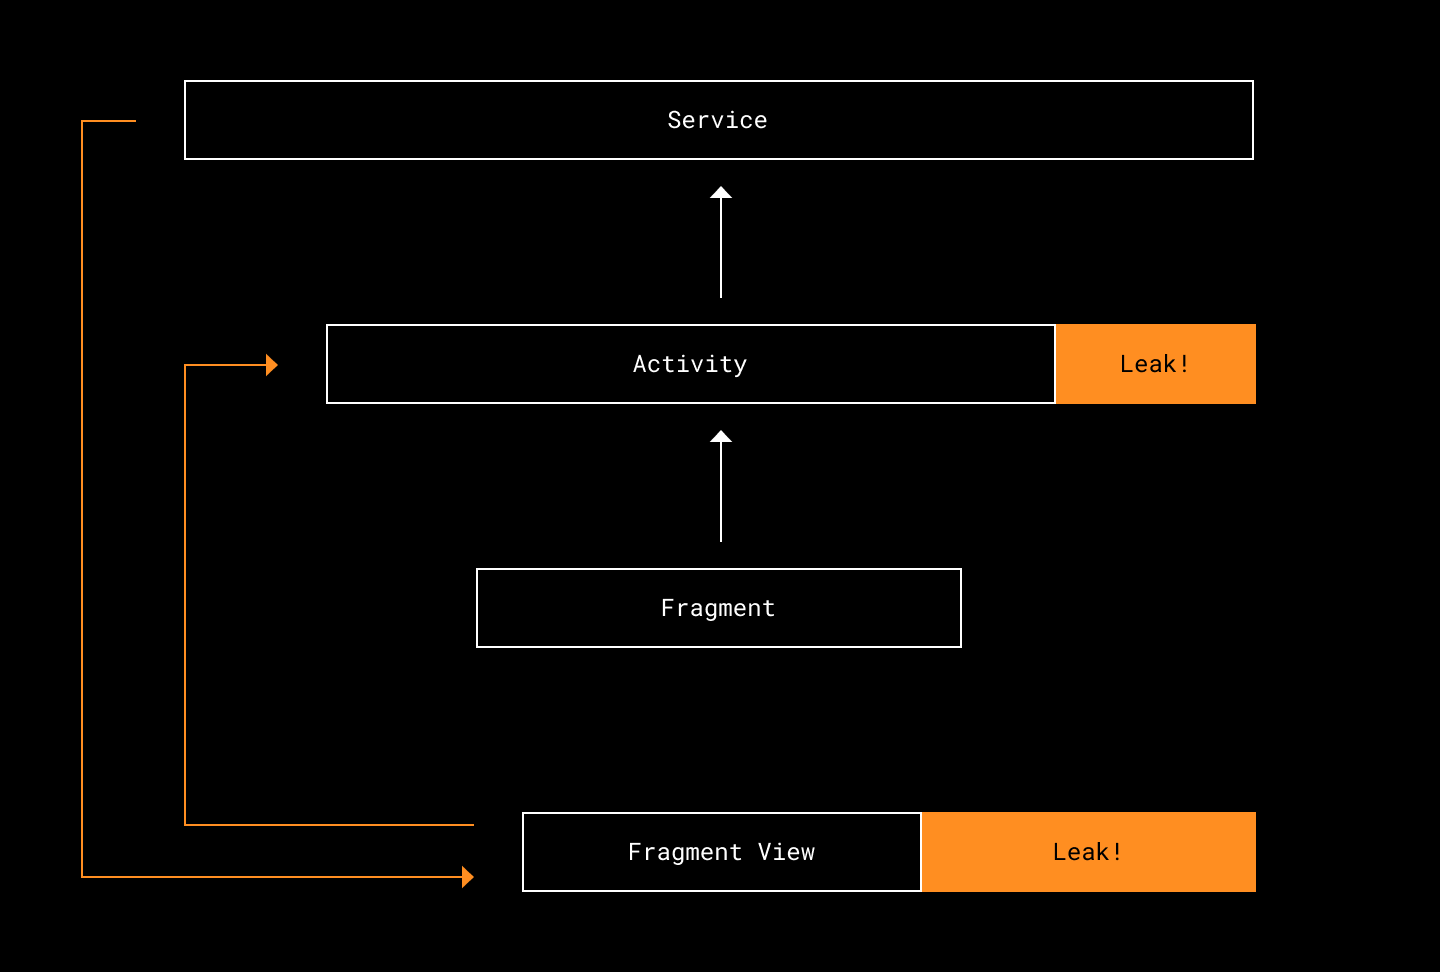
Common Causes
On Android:
- Static references holding Activity context
- Long-lived singletons storing UI references
- Coroutines not cancelled in onDestroy
- Listeners not unregistered
On iOS:
- Strong reference cycles (retain cycles)
- Closures capturing self without [weak self]
- Delegates not marked weak
On Flutter:
- Controllers not disposed
- Streams not cancelled
- Global state persisting unnecessarily
Memory leaks are dangerous precisely because they are quiet.
The first five minutes of usage rarely reveal a memory leak. The thirtieth minute does.
Detecting Memory Leaks in Real Projects
Instrumentation is essential. Stability cannot rely on intuition.
On Android, LeakCanary provides automatic detection of retained activities and fragments during debug sessions.
debugImplementation "com.squareup.leakcanary:leakcanary-android:2.12"For heap inspection at runtime:
adb shell dumpsys meminfo com.example.appRepeated navigation cycles should not cause heap size to increase indefinitely.
On iOS, Xcode Instruments offers Allocations and Leaks tools. If heap memory continues growing after dismissing views, something is being retained unexpectedly.
In Flutter, DevTools’ Memory tab reveals Dart heap growth, allocation spikes, and retained widget trees. If garbage collection runs but memory never stabilizes, investigation is required.
Leak detection should be part of QA, not an afterthought.
Garbage Collection and Allocation Pressure
Not all instability comes from leaks. Sometimes the issue is not retained memory, but excessive allocation.
When an app frequently creates short-lived objects like during scrolling, animation, or list rebuilding, the garbage collector must run more often. Garbage collection pauses can block execution, and if the main thread is paused, frames are dropped.
Users do not see “GC pause time” in a log.
They experience:
- Scroll jitter
- Random stutter
- Input delay
- Inconsistent animations
For example, in Android:
overridefunonBindViewHolder(holder: ViewHolder, position:Int) {val formatter = SimpleDateFormat("dd-MM-yyyy")
    holder.date.text = formatter.format(items[position].date)
}
Creating a new formatter for every bind operation increases allocation overhead. A better approach:
privateval formatter = SimpleDateFormat("dd-MM-yyyy")overridefunonBindViewHolder(holder: ViewHolder, position:Int) {
    holder.date.text = formatter.format(items[position].date)
}
In Flutter, using const constructors prevents unnecessary rebuild allocations:
const Text("Static Label");The goal is not zero allocation. It is predictable allocation.
In high-interaction flows, aggressive allocation patterns can cause unpredictable smoothness even if total memory usage remains within limits.
Stability is not only about how much memory you use.
It is also about how efficiently you allocate and release it.
ANRs: When the App Stops Responding
On Android, an ANR (Application Not Responding) is triggered when the main thread remains blocked for too long.
On Android:
- 5 seconds for input events
- 10+ seconds for broadcast receivers
- 20+ seconds for services
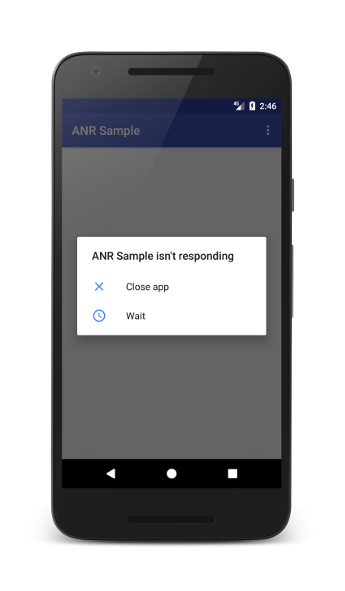
If the UI thread blocks for five seconds during input handling, the system shows an ANR dialog.
Imagine driving and suddenly the steering wheel locks. Even if it unlocks after a few seconds, confidence in the vehicle is gone.
ANRs typically result from:
- Blocking I/O operations on the main thread
- Long synchronous database queries
- Heavy computation inside UI callbacks
- Deadlocks between threads
- Improper coroutine or async handling
On Android, coroutines should isolate heavy work:
lifecycleScope.launch {valdata = withContext(Dispatchers.IO) {
        fetchLargeData()
    }
    updateUI(data)
}
StrictMode can detect accidental main-thread violations:
StrictMode.setThreadPolicy(
    StrictMode.ThreadPolicy.Builder()
        .detectAll()
        .penaltyLog()
        .build()
)
On iOS:
DispatchQueue.global(qos: .userInitiated).async {let data= fetchData()DispatchQueue.main.async {self.updateUI(data)
    }
}
In Flutter:
final result = await compute(parseLargeJson, rawJson);The main thread should orchestrate rendering and input. Everything else belongs elsewhere.
ANRs are particularly damaging because they feel like the app has frozen. Taps do not register. The screen does not update. In many cases, the operating system displays a dialog asking whether the user wants to close the app.
From the user’s perspective, the app has failed.
Crash Rates and the Cost of Scale
If memory leaks are gradual degradation and ANRs are momentary paralysis, crashes are hard stops.
A crash terminates the session immediately. Any context is lost. If it happens during a critical action - checkout, payment confirmation, data submission - the business impact is direct.
Crash stability is usually measured using metrics like:
| Metric | What It Indicates |
|---|---|
| Crash-free sessions | Percentage of sessions without crashes |
| Crash-free users | Percentage of users unaffected |
| OOM crash rate | Memory exhaustion frequency |
| Crash rate per release | Stability regression after updates |
A 99.5% crash-free session rate may appear acceptable. However, at one million active users, that remaining 0.5% represents thousands of disrupted experiences.
At scale, small percentages translate into significant real-world impact.
Memory Fragmentation and Long-Session Degradation
Beyond leaks and GC pressure, long-running apps can suffer from memory fragmentation. As memory is allocated and freed unevenly, the heap becomes fragmented, reducing allocation efficiency and increasing pressure on the allocator.
This manifests in:
- Longer allocation times
- Increased GC activity
- Progressive performance degradation
Fragmentation issues often appear in apps that handle large media assets, frequent image decoding, or dynamic view construction.
These are not startup problems. They are session-duration problems.
App Size: The Invisible Performance Multiplier
App size is rarely discussed during early development. Over time, it becomes a silent performance tax.
Larger binaries increase install time, reduce update adoption, and discourage users in bandwidth-constrained environments. Excessive size also increases memory mapping overhead at runtime.
App growth is gradual. SDK by SDK. Asset by asset.
Measurement precedes optimization.
Size Analysis
Android Studio’s APK Analyzer reveals DEX size, native library weight, and resource contributions. Dependency trees expose transitive library growth.
./gradlew app:dependenciesOn iOS, Xcode’s App Size Report identifies heavy asset bundles and framework contributions.
Optimization without analysis is guesswork.
Code Shrinking and Resource Minification
Enabling R8 or ProGuard removes unused classes and resources.
buildTypes {
    release {
        minifyEnabled true
        shrinkResources true
        proguardFiles getDefaultProguardFile('proguard-android-optimize.txt'), 'proguard-rules.pro'
    }
}
Dead code elimination reduces DEX size. Resource shrinking removes unused drawables and layouts. Reflection-heavy libraries require proper keep rules to avoid runtime crashes.
Image Optimization
Images frequently dominate binary size. Converting PNG assets to WebP significantly reduces footprint without sacrificing quality. Vector-based assets eliminate redundant density variants.
Optimized images reduce both install size and runtime memory consumption.
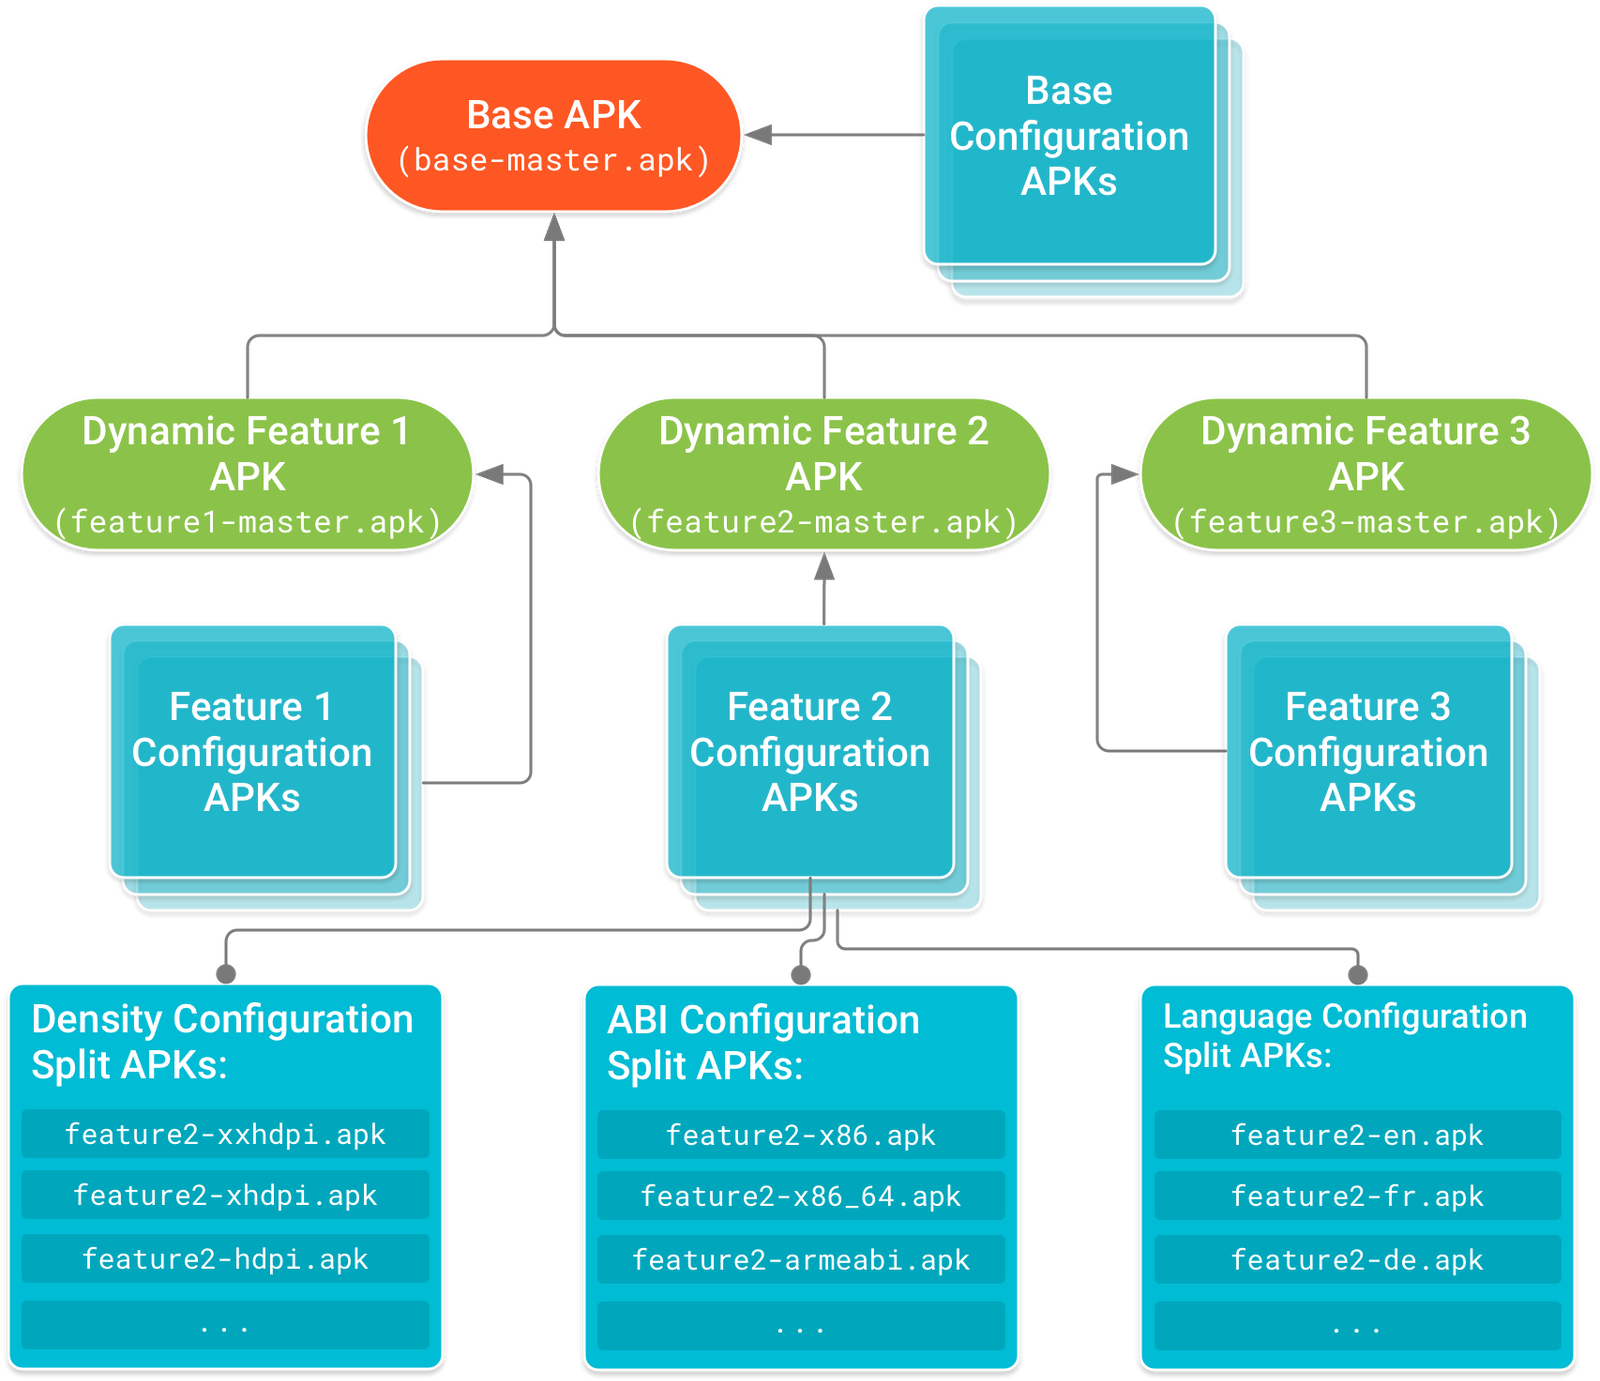
App Bundles and ABI Splits
Traditional APKs ship all architectures. Most devices require only one.
Android App Bundles allow Play Store to generate device-specific builds, reducing download size.
For manual splits:
splits {
    abi {
        enable true
        reset()
        include "armeabi-v7a", "arm64-v8a"
        universalApk false
    }
}
Native libraries are heavy. Shipping unnecessary architectures multiplies binary size.
Stability as a Measurement Discipline
Endurance problems are invisible without measurement.
The metrics required for stability differ from startup or smoothness metrics.
You need to monitor:
| Stability Metric | Why It Matters |
|---|---|
| Heap growth over session time | Detect memory leaks |
| Allocation rate | Identify churn |
| GC pause duration | Predict frame spikes |
| ANR rate | Detect UI thread blocking |
| Crash-free sessions | Measure release stability |
| App size per release | Track bloat trends |
| P95 / P99 session performance | Capture tail-risk behavior |
Average performance often hides instability. Tail metrics like P95 and P99, reveal where endurance breaks down.
Stability problems live in the edges, not the averages.
Production Is the True Environment
Local testing rarely replicates real-world usage. Developers test fresh installs on modern devices with stable networks and limited session duration.
Real users operate under:
- Background app competition
- Limited RAM
- Slower CPUs
- Extended session times
- Unstable network conditions
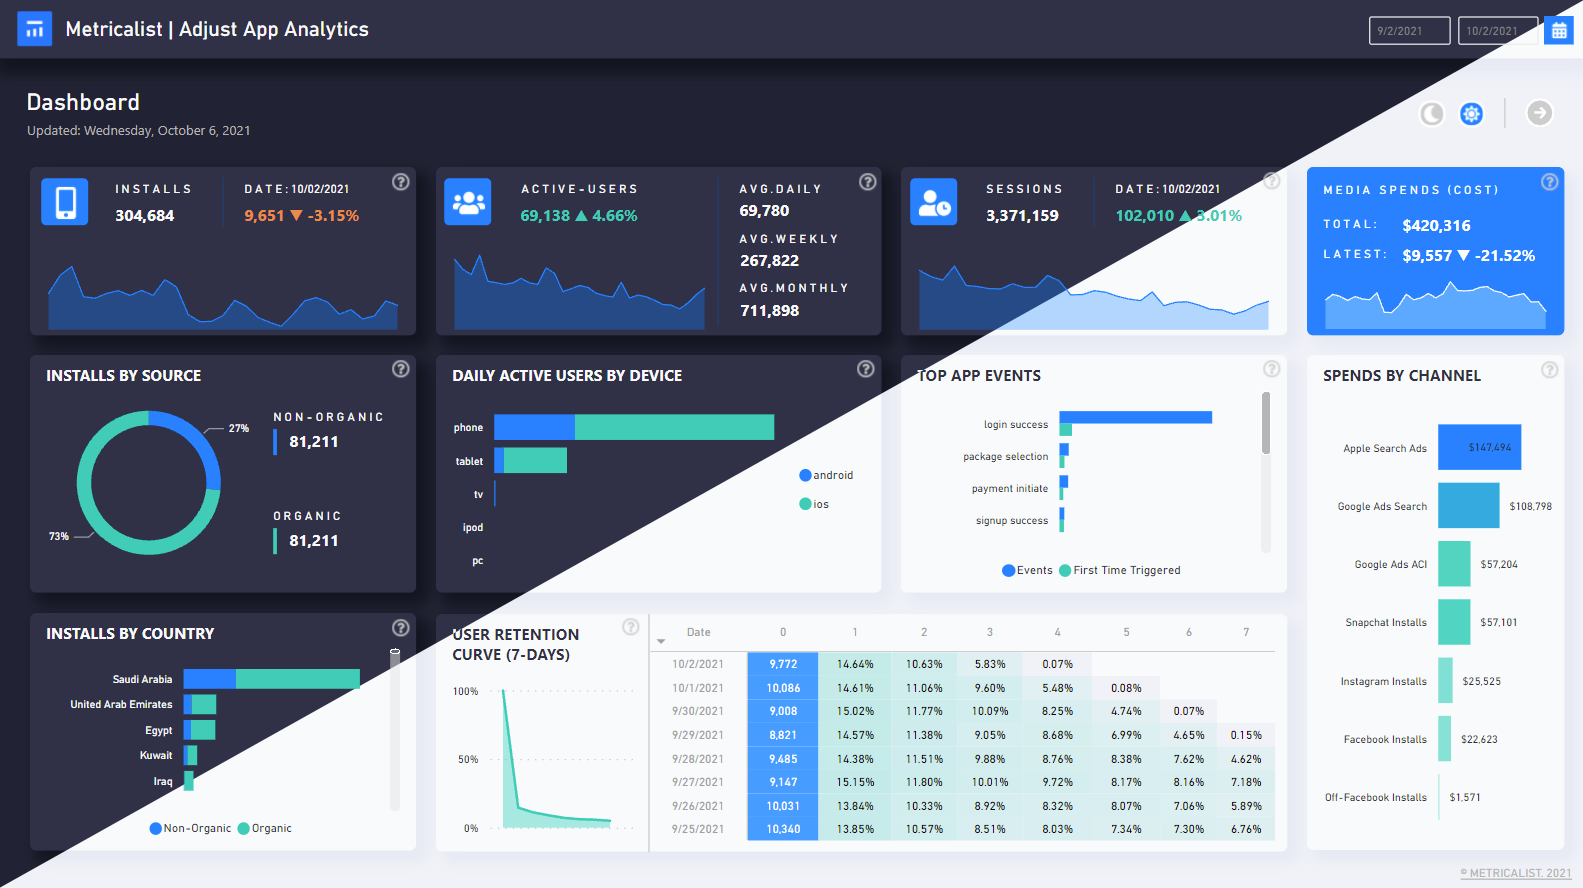
Production monitoring systems, including crash reporting tools and performance dashboards, expose:
- Device-specific memory pressure
- OS-version-specific crash patterns
- ANR spikes after releases
- Performance regressions in long sessions
Without production visibility, teams optimize the beginning of the journey while ignoring what happens later.
Preventing Long-Term Degradation
Stability is not a single fix. It is operational discipline.
Move heavy work off the main thread. Ensure background tasks are properly scoped. Clear references in lifecycle callbacks. Avoid static context retention. Audit listeners and subscriptions. Reuse objects where possible. Monitor large lists and media-heavy screens carefully.
Before every release, teams should ask:
- Did memory footprint increase?
- Did crash-free sessions decrease?
- Did ANR rates change?
- Did binary size grow?
- Did long-session performance degrade?
Performance must be evaluated per release, not per feature.
The Real Meaning of Reliability
Startup speed earns attention. Runtime smoothness earns comfort. Screen load speed earns engagement.
Stability earns trust.
If an app slows down after twenty minutes, crashes during checkout, or freezes while typing, users do not think about heap fragmentation or allocation churn.
They leave.
Performance is not just about how fast an app begins. It is about how reliably it continues.
An app that survives long sessions, heavy interaction, and scale without degradation is not just fast. It is dependable.