
TL;DR: Most teams measure personalization by looking at click-through rate on a personalized campaign and calling it a result. That is not a result. It is an activity metric contaminated by selection bias, because the users who qualify for personalization are already higher-value users who would have converted at a higher rate regardless. This article covers why measuring personalization correctly is genuinely difficult (selection bias, attribution confusion, long time horizons), the holdout group method as the only clean way to isolate causal effect, what to measure instead of CTR (retention delta, session depth change, conversion lift, LTV change over 30 to 90 days), why segment-level measurement matters more than aggregate measurement, the leading indicators that predict success before lagging retention data confirms it, what to do when a personalization variant is not outperforming the generic experience, and a maturity model for getting from "we look at CTR" to defensible causal measurement. Sourcing note: Statistics are attributed throughout. Where a methodology is described without a specific cited statistic, that reflects established measurement practice rather than a single study.
Ask a growth team how their personalization is performing and the answer, in most cases, will be a click-through rate. The personalized recommendation widget gets an 8% CTR. The personalized onboarding flow has a 65% completion rate. The personalized offer converts at 12%. These numbers get presented in a quarterly review as evidence that personalization is working, and the team moves on to build more of it.
None of these numbers answer the question that actually matters: did personalization cause an outcome that would not have happened otherwise? A personalized recommendation shown to users who are already your most engaged segment will get a high CTR regardless of whether the recommendation logic added any value, because that segment clicks on things at a higher rate than your average user. The CTR is real. The causal claim built on top of it is not.
This is the central measurement problem in personalization, and it is harder than measuring almost any other product intervention, for reasons specific to how personalization is built and deployed.
Why Measuring Personalization Is Hard
Selection bias is structural, not accidental. Personalization, by definition, targets users based on some characteristic: their behaviour, their segment, their lifecycle stage, their declared preferences. The users who receive a personalized experience are not a random sample of your user base. They are selected precisely because they exhibit a trait the personalization logic is built around. A personalized upsell offer shown to users who have made three or more purchases will convert at a higher rate than your overall conversion rate, not necessarily because the personalization is effective, but because users who have made three or more purchases are already more likely to purchase again.
This is not a measurement inconvenience that can be corrected with a formula after the fact. It is structural to how personalization works. The targeting logic and the measurement confound are the same mechanism. Any team that compares the conversion rate of a personalized segment against the conversion rate of the general user base is comparing two populations that differ on every dimension related to the outcome, not just on whether they received personalization.
Attribution confusion compounds the bias. Personalization rarely operates in isolation. A user who receives a personalized in-app recommendation may also be in an email nurture sequence, may have seen a push notification, may be responding to a price change, or may simply be at the point in their natural product journey where they were going to convert regardless. Attribution for personalized campaigns is challenging, and companies relying on simple attribution models tend to overstate the effectiveness of any single intervention, including personalization, because they assign full credit to the last touchpoint without accounting for what would have happened in its absence. When personalization is one of several interventions stacked on the same user in the same window, isolating its specific contribution requires a method that controls for the other interventions, not just a metric that counts engagement with the personalized element.
The time horizon problem. Personalization's strongest effects are frequently not visible in the first session or even the first week. A personalized onboarding flow might not show its real impact until 60 or 90 days, when the cohort that received it shows materially different retention than the cohort that did not. A team that evaluates personalization based on first-session engagement metrics is measuring the wrong window. The CTR on a personalized recommendation in session one tells you almost nothing about whether that recommendation changed the trajectory of the user's relationship with the product. The metrics that matter accumulate over a longer horizon than most quarterly reporting cycles are built to capture, which creates organisational pressure to report on what is measurable quickly (CTR, immediate conversion) rather than what is actually diagnostic (retention delta, LTV change).
These three problems compound each other. Selection bias means the comparison group is wrong. Attribution confusion means the causal channel is unclear even with the right comparison group. The time horizon problem means the team is often measuring before the real effect has had time to manifest. Each of these failure modes alone would make personalization measurement difficult. Together, they explain why so many teams that believe their personalization is working have never actually established that it is.
The Holdout Group Method: The Only Clean Way to Measure Causal Effect
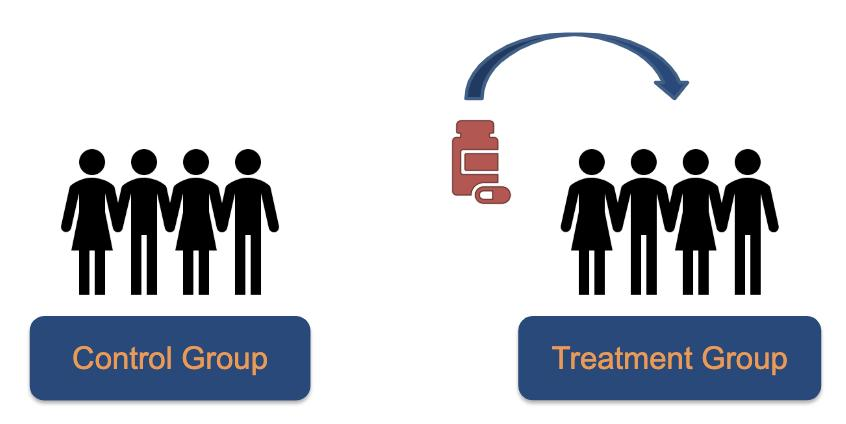
A holdout group is a randomly selected subset of users who would otherwise qualify for a personalization treatment but are deliberately excluded from receiving it, for the explicit purpose of providing a clean comparison group. A holdout test is a rigorous experimental methodology used to precisely measure a campaign's incremental impact by deliberately excluding a randomly selected segment of the audience from exposure to the intervention. This method, borrowed directly from the structure of a randomized controlled trial, is the only approach that isolates the causal effect of personalization from the selection bias inherent in who qualifies for it.
The mechanism is straightforward in principle and requires discipline in execution. Identify the population that would normally receive a personalization treatment based on your targeting logic. Before deployment, randomly split that population into a treatment group (receives the personalization) and a holdout group (does not, and instead receives the generic, non-personalized experience). Randomized splitting ensures the two groups are statistically comparable, which is the foundation of drawing valid conclusions from the test. Track both groups over the same time window using the same outcome metrics. The difference between the two groups' outcomes is the causal lift attributable to personalization, because randomization ensures the only systematic difference between the groups is whether they received the treatment.
The case for why this matters is best illustrated by what happens when teams skip it. In one documented holdout test on a catalogue mailing campaign, a brand found that the campaign was delivering a 14% incremental lift in revenue among recipients, far below the 40% contribution claimed by the vendor's attribution reporting. The attribution model, which counted any purchase by a recipient as campaign-driven, was overstating the effect by nearly threefold because it counted purchases that would have happened anyway. This pattern, attribution models systematically overstating incremental impact relative to holdout-measured lift, is consistent across marketing measurement research and applies directly to in-app personalization measurement.
Designing a holdout group correctly for in-app personalization:
The holdout population must be randomly assigned, not assigned by any criterion correlated with the outcome. If the holdout group is selected based on users who are harder to reach, lower engagement, or any non-random characteristic, the comparison is contaminated again. True randomization within the qualifying population is non-negotiable.
The holdout group should be a meaningful but not excessive fraction of the qualifying population, typically 10 to 20% for most in-app personalization tests. Large enough to produce statistically significant results, small enough that the opportunity cost of withholding a potentially beneficial experience from a portion of users is acceptable. The exact size depends on your baseline conversion rate and the minimum detectable effect you need to observe.
The holdout group should persist for the full measurement window, not just the initial campaign period. If you are measuring 90-day retention lift, the holdout group must remain a holdout group for the full 90 days, not just during the period when the personalized experience was actively delivered. Users who move out of the holdout group partway through the measurement window contaminate the comparison.
The holdout group should receive the standard, non-personalized experience, not nothing. A user excluded from a personalized recommendation widget should still see the generic version of that widget, not an empty space. The comparison you want is personalized versus generic, not personalized versus absent.
Holdout group experimentation prevents the overestimation of campaign impact that is the most common failure mode of attribution-based measurement, and provides an accurate measure of cumulative impact over time that individual session-level metrics miss. For any personalization investment significant enough to warrant a dedicated measurement question, a holdout group is the only approach that answers it with confidence.
What to Measure: Beyond CTR to the Downstream Outcome
CTR on a personalized element tells you that users interacted with it. It does not tell you whether that interaction produced a meaningfully different outcome than the user would have had without it. The metrics that actually answer the question of whether personalization is working are downstream of the initial interaction, measured over a time horizon long enough for the effect to manifest.
Retention delta. The percentage point difference in Day 7, Day 30, or Day 90 retention between the personalized cohort and the holdout group is the single most important metric for most personalization investments. A personalization treatment that produces a 5 percentage point improvement in Day 30 retention relative to the holdout group is producing a measurable, durable effect. A 5% increase in Day 1 retention has been associated with up to 85% higher long-term revenue in mobile app data, which illustrates how small retention deltas compound into significant downstream value. Retention delta should be measured at multiple horizons (D7, D30, D90) because effects that are present early can fade, and effects that are absent early can emerge later as the personalization compounds with continued usage.
Session depth change. The number of meaningful actions completed per session, compared between the personalized and holdout cohorts. If personalization is genuinely helping users find more relevant content or features, session depth in the treatment group should increase relative to the holdout group. If session depth is flat or declines in the treatment group, the personalization may be adding friction or narrowing the user's exploration of the product rather than enhancing it.
Conversion lift. For personalization tied to a specific conversion event (purchase, subscription upgrade, feature activation), the conversion rate difference between treatment and holdout, measured over a window long enough to capture delayed conversions. A personalized offer might not convert in the session it was shown but might influence a conversion decision made several days later. Measuring only same-session conversion undercounts the actual effect.
LTV change over 30, 60, and 90 days. The most rigorous and most delayed metric, but the one most directly tied to business value. If personalization genuinely improves the user's relationship with the product, that should eventually show up in lifetime value: more transactions, higher transaction value, longer tenure, or some combination. LTV measurement requires the longest time horizon and the most patience, but it is the metric that ultimately justifies continued investment in personalization capability.
Feature adoption rate. For personalization aimed at improving discovery of underused features, the rate at which the treatment cohort adopts the targeted feature compared to the holdout cohort is a direct measure of whether the personalization achieved its specific goal, independent of whether that goal translates immediately into retention or revenue.
The pattern across all of these metrics: each one requires a comparison against a holdout group, and each one requires measurement over a time window appropriate to when the effect would plausibly manifest. CTR fails on both counts. It has no built-in comparison group (everyone who saw the element either clicked or did not, with no counterfactual), and it is measured at the moment of interaction rather than over the window where the real impact accumulates.
The Segment-Level View: Why Aggregate Measurement Hides the Real Picture

Personalization that improves outcomes in aggregate can simultaneously be making outcomes worse for a specific segment, and aggregate measurement will not reveal this. This is one of the most consequential and most commonly missed failure modes in personalization measurement.
Consider a personalization system that, in aggregate, produces a 4 percentage point retention lift relative to a holdout group. That looks like a clear success. But if the lift is concentrated entirely in your highest-engagement segment (a 10 percentage point lift for power users) while your at-risk segment, the users closest to churning, shows a 2 percentage point decline relative to their own holdout, the aggregate number is masking a personalization system that is making your churn problem worse for exactly the users where churn is most costly to prevent.
This happens more often than aggregate reporting reveals, for a structural reason: power users and highly engaged segments generate more events, more sessions, and more opportunities for the personalization system to demonstrate its effect. Their behaviour dominates the aggregate statistics simply because they generate more data, even when they represent a smaller share of total users. A personalization win concentrated in a segment that was already going to retain well is a much smaller business win than the same percentage lift in a segment that was at genuine risk of churning, but the aggregate metric does not distinguish between them.
The fix is straightforward in concept and requires deliberate effort in execution: run the holdout comparison within each meaningful segment, not just across the full population. Define your segments (by lifecycle stage, by engagement tier, by value tier, however your business meaningfully differentiates users) before running the measurement, and report retention delta, session depth change, and conversion lift separately for each segment.
Cohort analysis grouped by acquisition source or behavioural pattern lets you judge interventions on the quality of impact, not just the aggregate volume. If a feature is well received by one cohort but does not resonate with another, that is exactly the signal segment-level measurement is designed to surface. A personalization investment that lifts your "Champions" segment while quietly hurting your "At-Risk" segment is, on balance, a poor investment if At-Risk users represent meaningful revenue or strategic value, even though the topline number looked positive.
The practical reporting standard: any personalization measurement summary should include a segment breakdown table, not just an aggregate figure. If your measurement infrastructure cannot produce segment-level retention deltas, that is a measurement maturity gap to close before drawing conclusions from the aggregate number.
Leading vs. Lagging Indicators: What Predicts Success Before Retention Confirms It
Retention delta over 30 or 90 days is the most reliable measure of personalization effectiveness, but it is also the slowest to arrive. Teams need earlier signals to know whether a personalization investment is on a trajectory toward success or failure, without waiting three months for the lagging metric to confirm it.
Leading indicators predict future performance based on early user behaviours and engagement patterns, while lagging indicators (like retention and revenue) are the downstream results those early behaviours produce. The relationship between the two is not speculative. It is a connection that should be validated empirically within your own product, but the general pattern holds across most mobile apps: early behavioural signals in the first session or first week correlate strongly with the retention outcomes that arrive weeks later.
Feature adoption rate within the first week. Feature adoption depth in the first week after a relevant lifecycle moment is a leading indicator that predicts retention even when other early signals look healthy. If personalization is meant to drive discovery of a specific feature, the rate at which the treatment cohort adopts that feature within seven days, compared to the holdout cohort, is an early read on whether the personalization is achieving its mechanism of action.
Session depth in the first week. Comparing actions per session between treatment and holdout cohorts in the first seven days provides an early signal before the 30 or 90 day retention numbers are available. Low session depth predicts low retention even when sign-up numbers look healthy, and the inverse holds: elevated session depth in the personalized cohort relative to holdout, sustained over the first week, is a positive early signal worth monitoring as the longer-horizon metrics accumulate.
Time-to-second-session. Watch time, completion, and time-to-second-session predict churn before it happens, functioning as an early indicator that gives teams a warning ahead of the lagging retention metric. For personalization specifically: does the treatment cohort return for a second session sooner, on average, than the holdout cohort? A compressed time-to-second-session in the treatment group is a meaningful early positive signal.
Dismissal and engagement rate trends within the first 10 sessions. A personalization treatment whose engagement rate is declining session over session, even within the first 10 sessions, is showing an early version of the fatigue pattern that would eventually show up as a retention deficit. Catching this trend early, before the full 30-day retention window closes, allows for course correction before the cohort is fully exposed to a degrading experience.
The discipline required here is connecting leading indicators to lagging outcomes empirically, not assuming the relationship based on general principle. The most effective way to use both indicator types is to start with the lagging goal, work backward, and use historical data or experimentation to test correlations between candidate leading indicators and the lagging metric you actually care about. A leading indicator that has not been validated as predictive of your specific retention outcome is a guess, not a leading indicator. The validation work, correlating early-session behavioural differences in past holdout tests against the retention deltas those same cohorts eventually produced, is what converts a plausible-sounding early metric into a genuinely predictive one.
The Iteration Signal: What to Do When a Variant Isn't Outperforming the Generic Experience
Personalization, measured correctly with a holdout group over an appropriate time horizon, will sometimes show that a treatment is not outperforming the generic experience. This outcome is data, not failure. How a team responds to it is one of the clearest signals of personalization measurement maturity.
Confirm the result has reached sufficient statistical power before drawing a conclusion. A holdout comparison that has not accumulated enough volume in both groups to detect the minimum effect size you care about is inconclusive, not negative. Calculate the required sample size before running the test, based on your baseline conversion or retention rate and the smallest lift you would consider meaningful. Stopping a test early because the interim results look unfavourable, before reaching the pre-specified sample size, produces unreliable conclusions in either direction.
Check whether the null result is uniform across segments. A personalization treatment that shows no aggregate effect might be masking a positive effect in one segment offset by a negative effect in another, which nets out to zero in aggregate but represents two distinct findings, each actionable in its own right. The segment-level view, covered above, is the diagnostic tool for this case. Before concluding "personalization does not work for this use case," confirm that the null result is genuinely uniform rather than a cancelled-out mixture.
Distinguish between a logic failure and a relevance failure. If a personalization treatment is not outperforming the generic experience, the cause could be that the targeting logic is selecting the wrong users for the treatment, that the personalized content itself is not more relevant than the generic version despite correct targeting, or that the personalization mechanism (the way the adaptation is surfaced, its timing, its prominence) is undermining an otherwise sound targeting and content strategy. Each of these requires a different fix. Diagnosing which one is responsible requires looking at engagement with the personalized element itself (did users interact with it at all) separately from the downstream outcome (did interaction translate to a different result than the generic path).
Treat a confirmed null result as the basis for reallocating effort, not for repeating the same approach with minor tweaks. If a holdout-validated test shows no meaningful lift after reaching statistical power, and the segment-level and diagnostic analysis does not reveal a hidden positive effect or an obvious mechanism failure to fix, the evidence is telling the team that this specific personalization investment is not producing value relative to the simpler, non-personalized alternative. The resource-rational response is to redirect the engineering and design effort that would have gone into refining this treatment toward a different personalization hypothesis or a different part of the product entirely, rather than running incremental variations on a mechanism that has not demonstrated a causal effect.
Document the negative result. A null or negative holdout result is valuable institutional knowledge. Teams that do not document confirmed null results frequently re-test the same hypothesis 12 to 18 months later because the original finding was never written down anywhere a new team member would find it. A lightweight log of validated personalization hypotheses, including the ones that did not work, prevents this waste.
The Maturity Model for Personalization Measurement
Most teams' personalization measurement practice falls somewhere on a spectrum from purely activity-based to fully causal, segment-level, and LTV-attributed. Understanding where your team sits on this spectrum is the first step toward improving it.
Level 1: We look at CTR. The team tracks click-through rate, open rate, or engagement rate on personalized elements and treats higher numbers as evidence of success. No comparison group exists. No segment breakdown exists. Conclusions drawn at this level are almost certainly contaminated by selection bias, because the population that receives personalization differs systematically from the population that does not, in ways correlated with the outcome being measured.
Level 2: We compare personalized users to non-personalized users, but without randomization. The team compares outcomes for users who happened to receive personalization against outcomes for users who did not, typically because the latter group did not qualify for the targeting criteria. This is an improvement over Level 1 because there is at least a comparison, but the comparison is still contaminated: users who did not qualify for personalization are different from users who did, by definition, on the exact dimension the targeting logic uses. The comparison measures the difference between the segments, not the effect of personalization.
Level 3: We run holdout groups, but only look at immediate metrics. The team has implemented proper randomized holdout testing, which solves the selection bias problem, but still evaluates results based on session-level engagement or immediate conversion rather than retention delta or LTV change over an appropriate time horizon. This level produces clean comparisons but draws conclusions from the wrong time window, missing both delayed positive effects and delayed negative effects (like the fatigue pattern that shows up only after repeated exposure).
Level 4: We run holdout groups and measure retention delta and conversion lift over 30 to 90 days. The team has solved both the selection bias problem and the time horizon problem. This is the level at which personalization measurement becomes genuinely defensible. Conclusions drawn here can support real investment decisions because they reflect causal effect over a meaningful business horizon.
Level 5: We have holdout groups, segment-level measurement, and LTV attribution. The team measures causal effect over an appropriate time horizon, broken down by meaningful user segments, and connects the personalization investment to lifetime value rather than just retention or conversion as proxies. At this level, the team can answer not just "is personalization working" but "is personalization working for the users where it matters most, and is the magnitude of the effect large enough to justify continued or expanded investment."
Most teams in mobile growth functions operate at Level 1 or Level 2. Moving to Level 3 requires implementing holdout group infrastructure, which is primarily an engineering and process change rather than an analytical one. Moving from Level 3 to Level 4 requires patience and organisational tolerance for measurement windows that extend beyond the typical sprint or quarterly cycle. Moving to Level 5 requires segment definition discipline and LTV modelling capability that many teams have not yet built, but that compounds in value with every subsequent personalization decision it informs.
When to Declare That Personalization Is Working: The Evidence Threshold
The question of when a team has sufficient evidence to declare personalization is working, and to justify further investment in the capability, deserves an explicit standard rather than an intuitive judgment call.
The minimum evidence threshold that justifies continued or expanded investment in a personalization capability:
A holdout-validated retention delta of at least 2 to 3 percentage points at the 30-day mark, sustained or growing at the 90-day mark. A smaller delta may be real but is difficult to distinguish reliably from noise without very large sample sizes, and a delta that shrinks between 30 and 90 days suggests a novelty effect rather than a durable improvement in the user relationship with the product.
Consistency across at least two of your three or four most important user segments. A lift concentrated entirely in one segment, particularly if that segment was already your strongest performer, is weaker evidence than a lift that appears across multiple meaningfully different segments. Consistency across segments is evidence that the personalization mechanism is producing genuine value rather than amplifying an effect that was already present in one group.
Statistical significance at the sample size the team pre-specified, not an interim peek. A result that only reaches significance after the team has repeatedly checked an ongoing test and stopped at a moment when the numbers looked favourable is not reliable evidence. The sample size and stopping point should be determined before the test begins.
A positive or neutral effect on session depth and feature exploration, not just on the targeted conversion metric. Personalization that improves a narrow conversion metric while reducing the breadth of features or content the user engages with may be optimising for a short-term win at the cost of the broader product relationship. Checking session depth as a secondary metric guards against this trade-off going unnoticed.
When these conditions are met, the evidence supports treating the specific personalization mechanism as validated and worth scaling, worth investing further engineering and design resources in, and worth using as a template for similar personalization hypotheses elsewhere in the product. When they are not met, even if some individual metric looks favourable, the appropriate organisational response is continued testing or reallocation of effort, not declaration of success.
Topics Not in the Brief That Teams Should Know
The novelty effect and its measurement implications. Many personalization treatments show their strongest lift in the first few weeks after launch, driven partly by genuine improvement and partly by the simple novelty of something new appearing in the product. Cohort retention curves should be read by their shape: a curve that plateaus at a high level indicates a durable effect, while a curve that declines steadily after an initial spike suggests the early lift was driven by novelty rather than lasting value. Measuring only the first 14 to 30 days of a new personalization treatment risks mistaking a novelty bump for a durable improvement. The 90-day measurement window matters specifically because it is long enough for novelty effects to fade and reveal the underlying durable effect, if any.
Interaction effects between concurrent personalization treatments. When multiple personalization mechanisms are running simultaneously (a personalized onboarding flow, a personalized recommendation widget, a personalized offer), their combined effect on a user is not necessarily additive. Two treatments that each show positive lift in isolated holdout tests may interact negatively when combined, either because they compete for the user's attention in the same session or because their targeting logic overlaps in ways that double-count the same underlying signal. Testing personalization mechanisms in combination, not just in isolation, becomes necessary once a team is running more than two or three concurrent personalization treatments.
The cost side of the ROI equation. Most personalization measurement focuses entirely on the lift side: retention delta, conversion lift, LTV change. The complete picture requires weighing that lift against the cost of building, maintaining, and operating the personalization system: engineering time, the ongoing data quality work covered in the data foundation article, and the segment management overhead covered in the over-personalization article. A personalization mechanism with a small but real positive lift may not be worth continued investment if its maintenance cost exceeds the value of the lift it produces. The evidence threshold for "is this working" should be paired with a separate question: "is this worth what it costs to maintain."
Pre-registration of hypotheses as a discipline against post-hoc rationalisation. Before running a holdout test, write down the specific hypothesis, the primary metric, the minimum detectable effect, and the segment breakdown the team will examine. This prevents the common failure mode where a null result on the pre-specified primary metric leads to searching through secondary metrics until something positive is found and reported as the headline result. Pre-registration is standard practice in rigorous experimentation and is straightforward to adopt in a product analytics context: a shared document, written before the test launches, that the team commits to evaluating against regardless of what the data eventually shows.
Key Takeaways
CTR on a personalized campaign is an activity metric, not an outcome metric. It does not control for selection bias, the fact that users who qualify for personalization are systematically different from users who do not, in ways correlated with the very outcome being measured.
Selection bias, attribution confusion, and the long time horizon over which personalization's real effects manifest are the three structural reasons personalization is genuinely difficult to measure correctly. None of them can be solved by a better dashboard. They require a different measurement method.
The holdout group method, randomly excluding a portion of the qualifying population from receiving personalization and comparing their outcomes to the treatment group, is the only approach that isolates causal effect from selection bias. Attribution-based estimates of personalization impact have been shown to overstate true incremental lift by as much as threefold relative to holdout-measured results.
The metrics that matter are downstream of the click: retention delta at 30, 60, and 90 days, session depth change relative to a holdout group, conversion lift measured over a window long enough to capture delayed decisions, and LTV change. Each requires a holdout comparison and a measurement window appropriate to when the effect would plausibly appear.
Personalization that improves aggregate outcomes can simultaneously be making outcomes worse for a specific segment, particularly at-risk users whose churn is the most costly to fail to prevent. Segment-level holdout comparison, not just aggregate measurement, is necessary to catch this pattern.
Feature adoption rate and session depth in the first week, and time-to-second-session, are leading indicators that predict longer-horizon retention outcomes, but only when validated empirically against your own product's historical holdout results, not assumed from general principle.
A confirmed null result, reached at sufficient statistical power and checked for hidden segment-level effects, is valuable data that should redirect effort, not be repeated with minor tweaks indefinitely. Documenting null results prevents teams from re-testing the same hypothesis a year later.
Most teams operate at Level 1 or 2 of the personalization measurement maturity model (CTR-based or naive comparison). The evidence threshold that justifies continued investment is a holdout-validated retention delta of 2 to 3 percentage points, sustained or growing at 90 days, consistent across multiple segments, reached at pre-specified statistical significance, without a corresponding decline in session depth.
Further Reading
From Digia Engage:
- The Data Foundation: What You Need to Clean Up Before Personalization Can Work — the data infrastructure that makes holdout group measurement and segment-level attribution possible
- Over-Personalization: When Too Much Adaptation Makes the App Feel Unreliable — what happens when personalization is scaled without the measurement discipline covered in this article
- Privacy-First Personalization: Building Relevance Under iOS ATT, GDPR, and User Trust — building personalization on first-party data, which is also the data foundation holdout measurement depends on
- Reducing Churn with Behavioral In-App Interventions — leading indicators of churn that complement the leading indicators covered in this article
External Sources:
- Holdout Test: Definition, Examples and Best Practices — Causality Engine (holdout methodology, randomization requirements, and statistical significance design)
- Mastering a Holdout Test in Marketing — Measured (the 14% vs. 40% case study showing attribution overstatement relative to holdout-measured lift)
- Holdout Groups in Marketing: The Only Way to Know If Your Campaigns Actually Work — Cassandra (randomization requirements, audience contamination diagnosis, and combining holdout testing with attribution models)
- Using Holdout Groups to Quantify Marketing Campaign Lift — Bluecore Engineering (holdout test mechanics specific to personalization platforms)
- The Difference Between Leading and Lagging Indicators — Mercury (feature adoption depth and session frequency as predictive leading indicators)
- Leading vs. Lagging Indicators: 20 Examples — Whatfix (methodology for validating which leading indicators are predictive of specific lagging outcomes)
- Consumer App Traction Metrics: 8 KPIs That Drive Growth — Qubit Capital (D1, D7, D30 retention as product-market fit indicators; feature adoption rate measurement)
- Cohort Analysis in 2026: How to Read the Chart, Choose a Platform, and Turn Retention into Growth — Mixpanel (segment-level cohort analysis for feature adoption and acquisition source comparison)
- Cohort Analysis for Apps: Boost Retention and Engagement — Apptrove (cohort-based churn prediction and segment-specific feature response patterns)
- Your Essential Guide to Cohort Analysis in Mobile Marketing — Adjust (predictive cohorting for early churn signals and segment-specific retention comparison)
- Retention and Engagement Analytics — Fora Soft (reading cohort retention curve shape to distinguish novelty effects from durable lift)
- Cohort Analysis » Addict Mobile — Addict Mobile (the compounding relationship between small retention deltas and long-term revenue)
- Personalization Statistics 2026 — Marketing LTB (attribution challenges for personalized campaigns; advanced measurement adoption rates among marketing leaders)
Holdout group infrastructure, segment-level audience filters, and retention-based campaign reporting are built into Digia Engage's measurement layer. Every nudge, widget, and survey campaign can be configured with a holdout audience from the same dashboard used to launch it, so the causal measurement standard covered in this article is achievable without a separate experimentation platform. Book a demo to see how holdout testing works for in-app personalization campaigns, or explore the Nudge Builder to see the targeting and audience configuration options available.