
TL;DR: In-app NPS surveys consistently outperform email NPS on response rates, data quality, and feedback timing. Mobile in-app NPS averages 27 to 36% response rates versus 5 to 15% for email NPS. The gap comes down to context: in-app surveys reach users while they are actively experiencing the product, while email surveys reach them hours or days later, out of context, in a crowded inbox. This guide covers the response rate data, placement options (modal, banner, inline), trigger timing, and a practical setup checklist for mobile teams.
What Is In-App NPS and How Is It Measured?
Net Promoter Score (NPS) is a single-question loyalty metric developed by Fred Reichheld at Bain & Company. It asks users: "How likely are you to recommend [product] to a friend or colleague?" on a scale of 0 to 10. Respondents fall into three groups: Promoters (9 to 10), Passives (7 to 8), and Detractors (0 to 6). The final score is calculated as percentage of Promoters minus percentage of Detractors, and it ranges from -100 to +100.
In-app NPS applies that same question inside the product, during an active user session, triggered by a behavioral event or time-based condition. The key difference from email NPS is not the question itself. It is where and when the question appears.
Most mobile growth teams collect NPS through one of two channels: an email sent after a session ends, or a survey widget that fires inside the app during a session. The delivery channel determines the response rate, the quality of feedback, and the representativeness of the data. Those three factors diverge significantly between the two methods.
Response Rate Data: In-App NPS vs Email NPS
This is the number most teams get wrong when they are comparing channels.
Refiner's 2025 In-App Survey Response Rate Report, which analyzed 1,382 in-app surveys with more than 5 million views, found the following:
- Average in-app survey response rate across web and mobile: 27.52%
- Mobile app surveys specifically: 36.14%
- Web app surveys: 26.48%
- In-app NPS surveys specifically: 21.71%
Email NPS tells a different story. CustomerGauge's B2B NPS benchmarks put the average email NPS response rate at 12.4%, with a range from 4.5% to 39.3% depending on list quality and relationship strength. Delighted's 2024 analysis places their users' email survey response rate at roughly 6%. Industry aggregations from Zonka Feedback's 2026 NPS benchmark report put embedded email NPS (where the rating scale appears directly in the email body) at 15 to 25%, and linked email NPS (requiring a click-through to a separate page) at 6 to 15%.
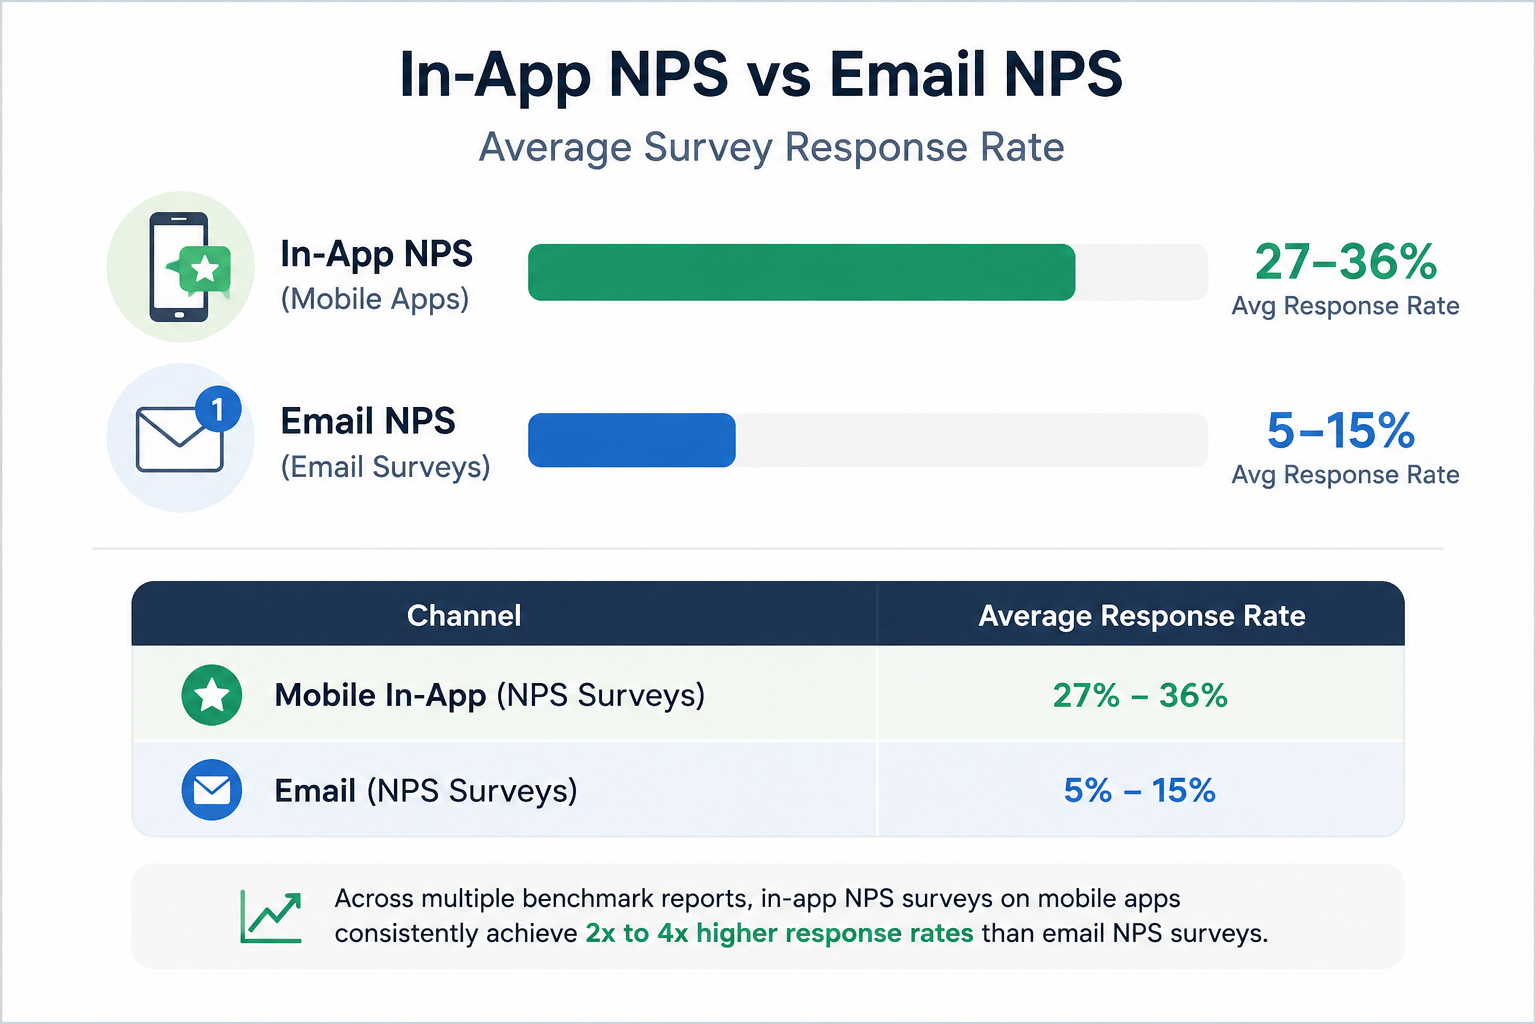
The picture is consistent across sources. In-app NPS on mobile apps produces 2x to 4x higher response rates than email NPS in most conditions. Digia Engage's own data shows in-app NPS response rates of 30% or higher, compared to a 3% baseline for email NPS on consumer mobile apps.
Email response rates have also declined over time. User Intuition data cited in 2026 NPS benchmarks shows that email survey response rates dropped from an average of 20 to 25% in 2019 to 10 to 15% in 2025, as inboxes became noisier and users became more selective about what they respond to.
Side-by-Side Comparison
| Metric | In-App NPS (Mobile) | Email NPS |
|---|---|---|
| Average response rate | 27% to 36% | 5% to 15% |
| Data context | Real-time, in-session | Retrospective, out of context |
| Sampling bias | Lower (more users respond) | Higher (only engaged users open email) |
| Targeting precision | Event-based, behavioral | Batch-scheduled, segment-based |
| User experience | Native to the app | External interruption |
| Time to first response | Minutes | Hours to days |
| Engineering dependency | None (no-code trigger) | Email platform required |
Why Email NPS Underperforms on Mobile
The mechanics behind the gap are not complicated.
When an email NPS survey lands in someone's inbox, the user is not thinking about your product. They might be between tasks, checking mail on their way to a meeting, or triaging a full inbox on a Sunday night. The experience that generated the NPS data they are being asked to evaluate might have happened two days ago. Memory is imperfect. Mood at the time of the email affects the score. And the user has to leave their current context, open the email, click through, and answer the question in a completely different environment from where the product experience happened.
In-app NPS removes all of those friction points. The survey fires at a defined moment during an active session. The user just completed a specific action or reached a specific milestone. The experience is fresh. The feedback reflects the actual session, not a reconstructed version of it from memory.
There is also a sampling issue with email NPS. Users who open survey emails skew toward the highly engaged and the highly dissatisfied. Passive users who had a neutral experience and never opened the email are systematically excluded from the data. In-app NPS, because it fires for all users who reach the trigger condition, produces a more representative sample of actual user sentiment.
Placement Options: Modal, Banner, and Inline
Where the NPS widget appears inside the app affects both response rates and user experience quality. There are three main placement approaches.
Modal (Center Screen)
A modal NPS widget is a full or partial overlay that appears at the center of the screen, pausing the user's current session. According to Refiner's 2025 placement data, center-screen modals produced the highest response rates in their study at 42.6% across 254 surveys. Top-centered modals showed an even higher rate of 47.8%, though the sample was smaller.
Modals work well for NPS because the survey is short: one rating question and one open-text follow-up. A modal that asks two questions and disappears in 20 seconds is not a significant session interruption. The risk is placement on the wrong screen at the wrong moment. A modal firing mid-checkout or mid-onboarding step breaks a critical flow and generates frustrated scores that reflect the interruption, not the product.
Banner (Bottom or Top Strip)
A banner places the NPS question in a slim persistent strip at the top or bottom of the screen. The user can continue their current task and respond to the survey at their own pace, or dismiss it without engaging. Banners have lower response rates than modals but generate less friction. Retently's in-app NPS analysis and Asana's own approach both favor banner placement for NPS, prioritizing non-disruption over maximum response rate.
For mobile apps where the primary user task is transactional (payments, orders, content consumption), banners preserve the session experience better than modals, even if fewer users respond. A lower response rate from genuinely voluntary feedback is often more reliable than a higher rate from users who answered just to dismiss a modal.
Inline (Embedded in UI)
An inline NPS element is embedded directly into the app's existing UI, typically on a summary screen, confirmation screen, or session-end screen, without any overlay behavior. The user encounters it as part of the natural flow rather than as an interruption. Response rates for inline NPS tend to be lower than modals, but the qualitative quality of responses is often higher because users who respond chose to engage rather than clearing a blocker.
Inline placement works best on screens that already have natural pause points: post-transaction confirmation screens, order completion pages, end-of-session summaries.
Timing: When to Trigger In-App NPS
Timing is where most teams get in-app NPS wrong, in both directions. They either trigger too early (before the user has enough context to form a real opinion) or too late (after the relevant moment has passed and the user is in a different part of the session).
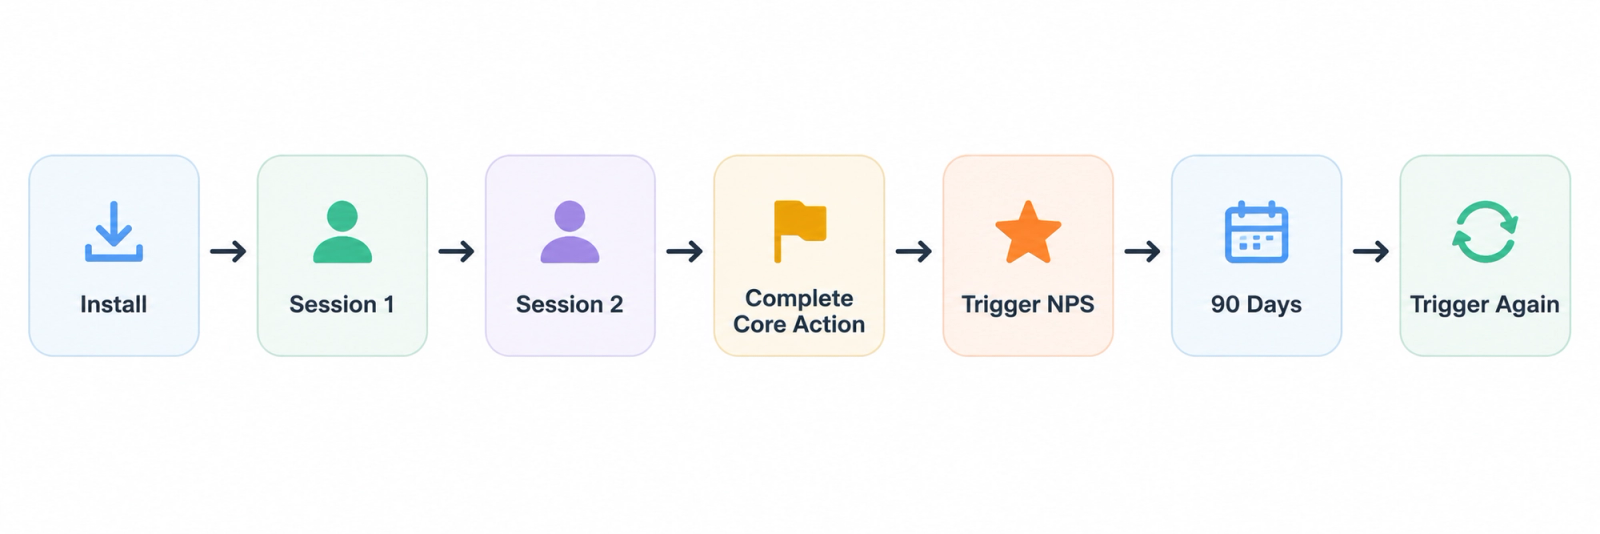
The conditions that consistently produce higher-quality responses are:
After 3 or more sessions. Users who have only opened the app once or twice do not have enough product experience to give a meaningful NPS score. Refiner's best practice guidance and Produktly's 2026 NPS guide both recommend waiting until the user has had multiple sessions and has completed at least one core workflow.
After a meaningful action. Trigger NPS after the user completes a key task: a successful payment, a feature workflow completion, an onboarding milestone. The experience is fresh, the user is in a positive state (having just accomplished something), and the feedback reflects actual product value.
Not during a critical flow. Avoid triggering NPS during checkout, during onboarding setup steps, during form completion, or during any sequence where interruption creates friction. The score a frustrated mid-task user gives reflects the interruption, not the product.
Every 90 days for recurring users. For long-term or daily-active users, a quarterly NPS cadence gives you trend data without creating survey fatigue. Some product teams with weekly-active users extend this to every 6 months.
Keeping In-App NPS Non-Intrusive: The Design Rules
High response rates are only valuable if the survey does not damage the session experience in the process of collecting them. A set of practical constraints keeps in-app NPS from becoming a friction point.
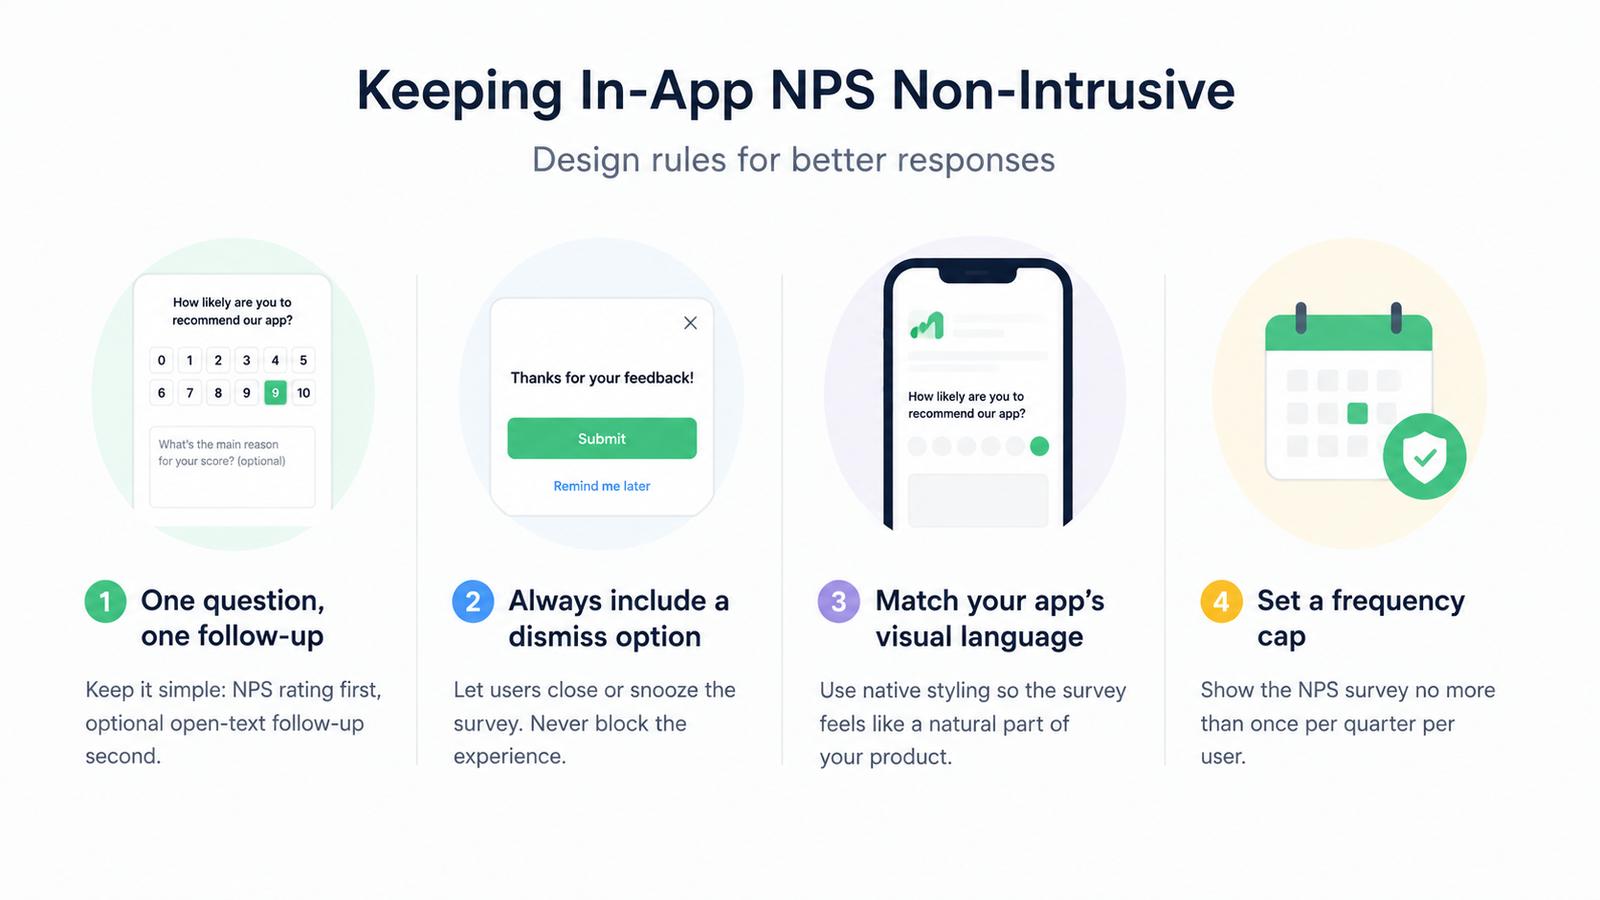
One question, one follow-up. The NPS rating scale is the first question. An optional open-text follow-up ("What's the main reason for your score?") is the second. Anything beyond that is a survey, not a pulse check, and completion rates drop.
Always include a dismiss option. Users who do not want to respond should be able to close the widget without feeling blocked. Forced engagement with an NPS widget generates noise, not signal. Offering a "Remind me later" option for users who are in the middle of a task also preserves response quality.
Match the widget to your app's visual language. An NPS widget that looks visually foreign to the rest of the app creates distrust. Users are more likely to respond when the survey feels like it belongs to the product. Refiner's 2025 guide specifically cites native styling as a factor in response rate.
Set a frequency cap. No user should see the NPS survey more than once per quarter. A frequency cap at the user level prevents over-surveying and maintains the perceived value of each NPS request.
Practical Setup Guide for Mobile Teams
Setting up in-app NPS correctly takes roughly the same amount of time as setting it up incorrectly, but produces dramatically different results. Here is the checklist.
Define your trigger condition. Choose a behavioral event that signals the user has experienced meaningful product value. "Completed 3 sessions AND completed core action X" is a better trigger than "opened the app." The precision of the trigger condition determines the quality of the data.
Choose your placement. For teams optimizing response rate, center-screen modals fire best on confirmation or summary screens. For teams prioritizing session experience, bottom banners or inline placements reduce friction.
Set targeting parameters. Exclude new users (under 7 days old), users in their first session, and users currently inside critical flows. Target only users who have reached the activation threshold you have defined.
Configure the follow-up question. Make it optional, keep it to a single open-text field, and make it specific: "What's the main reason for your score?" produces more actionable data than "Any other comments?"
Set the frequency cap. One NPS request per user per 90 days is the standard starting point. Adjust based on your app's session frequency.
Connect the data. Route NPS responses to the tool where your team acts on feedback: Slack, your CRM, your product management tool. An NPS score that sits in a survey dashboard and never influences a product decision is a missed opportunity.
With Digia Engage's Surveys feature, growth teams can configure in-app NPS with event-based triggers, frequency caps, and native styling from one dashboard, with no app release needed. Campaigns fire in under 100ms. For context on how NPS surveys fit into a broader in-app feedback strategy, see how in-app nudges work and Digia's Insights and Feedback use case page.
Key Takeaways
In-app NPS on mobile produces response rates of 27 to 36%, compared to 5 to 15% for email NPS. The gap is driven by context, timing, and sampling differences, not by survey design.
Modal placement generates the highest response rates (42.6% in Refiner's 2025 data). Banner and inline placements reduce session disruption at the cost of some response volume. The right choice depends on what matters more to your team in each specific context.
Trigger timing controls data quality. Surveys fired after meaningful actions, during natural session pauses, and after at least 3 sessions produce scores that reflect real product sentiment rather than in-the-moment friction.
Email NPS has declined as a primary feedback channel. Response rates dropped from 20 to 25% in 2019 to 10 to 15% in 2025. For consumer mobile apps, in-app NPS is now the more reliable primary channel, with email as a secondary option for users who dismiss the in-app prompt.
A non-intrusive in-app NPS setup requires four controls: one question plus one optional follow-up, a dismiss option, native visual styling, and a quarterly frequency cap per user.
Further Reading
From Digia Engage:
- What Are In-App Nudges and How Do They Work?: Trigger logic, format types, and session timing for in-app experiences
- Surveys and NPS Feature: How Digia Engage handles in-app NPS, emoji feedback, and quizzes without an app release
- Insights and Feedback Use Case: How mobile teams collect and act on in-app feedback across the user lifecycle
Sources
- Refiner In-App Survey Response Rate Report 2025: 1,382 surveys, 5M+ views, response rate and placement data
- Refiner In-App NPS Guide: Best practices, setup process, targeting, and FAQ
- Produktly In-App NPS Guide, March 2026: Timing, follow-up questions, and acting on NPS data
- Zonka Feedback NPS Survey Response Rate Benchmarks 2026: Channel-by-channel response rate data from 2024 to 2025 research
- CustomerGauge B2B NPS Benchmarks: B2B email NPS average of 12.4%
- Frill NPS Survey Response Rate Benchmarks: Historical email NPS decline from 2019 to 2025
- Retently In-App NPS Survey Best Practices: Placement examples from Asana, Retently, Groove
- Userpilot In-App NPS Survey Examples: Trigger timing and real-product examples
- AnnounceKit: In-App Banners vs Modals vs Tooltips: UX pattern comparison for survey placement
- Appcues NPS Best Practices: Page targeting, frequency caps, timing guidance
- 1Flow: How to Run In-App NPS: Response rate mechanics and segmentation approaches
- Bain and Company: Net Promoter Score methodology: Original NPS framework by Fred Reichheld
In-app NPS surveys on Digia Engage fire in under 100ms, require no app release, and are configurable from one dashboard for iOS, Android, React Native, and Flutter apps. Book a demo to see how it works inside your own product.