





TL;DR: Email surveys average 6% response rate in real-world deployments. In-app surveys in mobile apps average 36%. The gap is not brand affinity or question quality. It is context. The user is already in the product, already engaged, and the survey arrives in the same session as the experience it is asking about. That context advantage is real, but it is entirely possible to waste it with wrong timing, the wrong number of questions, or a format that treats the survey as an interruption rather than a natural continuation of the session. This article covers why in-app outperforms email by the specific mechanism that explains it, which survey types produce actionable data, the three timing moments that produce the highest response rates, why three questions is one too many, the design decisions that separate 15% from 30%, how to write questions users answer honestly in under 10 seconds, and what closing the loop actually looks like when teams do it well. Sourcing note: All statistics are attributed to their sources throughout. Where Digia Engage benchmark data is cited, the source is the Digia Engage platform.
Every product team has a version of the same experience. The email survey goes out to 5,000 users. The results come back from 300 of them. The data is skewed toward extremes (the people who loved something or hated something), the sample is barely representative, and the insights are stale by the time they arrive because the email was asking about an experience that happened three days ago. The team publishes a survey report, notes the limitations, and moves on.
Email surveys in real-world B2C deployments average around 6% response rate per Delighted's 2024 analysis. That means 94 of every 100 users who are asked for feedback choose not to provide it. The 6% who do are self-selected. They are not representative of the broader user population. They are the users with a strong enough opinion to open an email, click through to a survey, and spend time filling it out. The insight that comes back is real, but it is not representative.
In-app surveys change the denominator. Mobile app surveys average a 36.14% response rate, based on Refiner's 2025 analysis of 1,382 in-app surveys across 5 million views. The gap between 6% and 36% is not marketing language. It is six times more responses per survey sent, from a broader and more representative slice of the user population. The difference in data quality is structural, and this article explains exactly what produces it.
Why In-App Outperforms Email: The Specific Mechanism
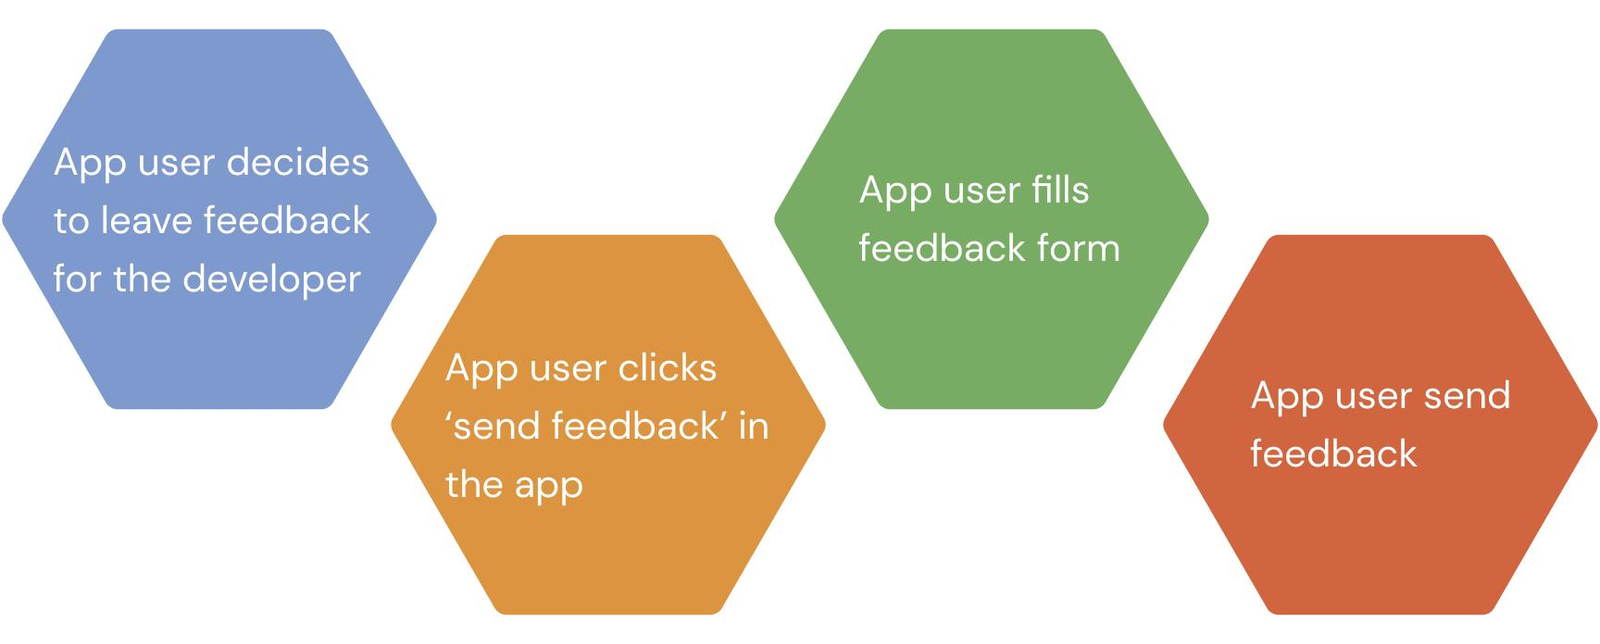
The explanation for in-app's performance advantage is not mysterious. It has three components, each of which independently contributes to higher response rates. Together, they produce a response environment that email cannot replicate regardless of subject line optimisation or send-time testing.
Engagement context. When an in-app survey fires, the user is already active in the product. They are not being interrupted from something unrelated. They are in the middle of, or just after completing, a product interaction. The survey arrives at a moment of natural engagement rather than demanding attention in an already-crowded inbox. A user who is mid-session in a fintech app has a different receptiveness to a quick feedback question than a user who receives an email hours after their last session while they are doing something else entirely.
Reduced friction. An email survey typically requires an inbox open, a link click, navigation to a survey page, and then the survey itself. Each step loses users. Surveys that require a click-through to a separate page get 6 to 15% response rates, while embedded in-email NPS (where the question appears directly in the email) achieves 15 to 25%. In-app surveys require zero additional navigation. The survey appears on the screen the user is already looking at. The distance between "survey appears" and "user answers" is one tap.
Moment-of-truth proximity. The quality of survey data is directly tied to how close the survey is to the experience being measured. An in-app survey asking about an experience at the moment it happens captures a live signal. The same question sent by email three days later is asking a user to reconstruct a memory. The question is identical. The data is not. This is why transactional NPS surveys (sent immediately after a specific interaction) achieve 25 to 40% response rates, compared to 15 to 25% for relational NPS surveys sent on a schedule. Timing is not a nice-to-have optimisation. It is the primary driver of both response rate and data accuracy.
The Survey Types That Produce Actionable Data In-App
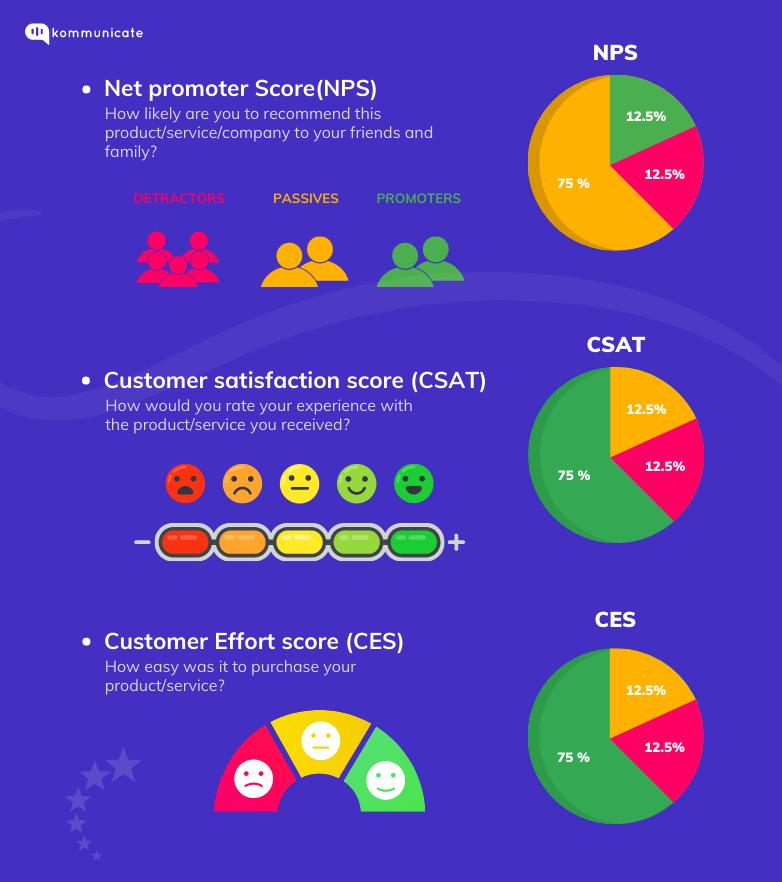
Not every survey type belongs in-app. The format works best for questions that are short, contextually triggered, and tied to a specific user experience the user just had or is currently having.
NPS (Net Promoter Score). The single-question NPS ("How likely are you to recommend this app to a friend or colleague?") is the standard in-app loyalty signal. In-app NPS response rates average 21.71% across Refiner's 2025 dataset, with timing and audience targeting determining whether a specific implementation lands closer to 15% or closer to 35%. NPS deployed immediately after a significant lifecycle event (onboarding completion, first investment, first order delivery) outperforms NPS deployed on a fixed schedule with no event trigger. The lifecycle trigger connects the loyalty question to a specific experience, which makes the user's response more considered and the data more actionable.
CSAT (Customer Satisfaction Score). CSAT asks about satisfaction with a specific interaction. In-app, it belongs immediately after a transaction is completed, a feature is first used, or a support interaction is resolved. CSAT outperforms NPS in Refiner's 2025 in-app data with a 26.29% average response rate versus 21.71% for NPS. CSAT is more specific by definition: it asks about this interaction, not the product overall. Users find it easier to answer a specific question about something they just did than a general loyalty question about the product as a whole.
Feature feedback surveys. A short survey (two questions: did this feature do what you expected, and what would make it better) deployed at first use of a new or updated feature gives the product team real-time signal on whether the feature is landing. This survey type is most valuable in the 14 days following a feature release, before the novelty signal fades. The question should be specific to the feature being tested, not general. "How was your experience with the new SIP calculator?" produces more actionable data than "How was your experience with the app today?"
Churn-risk probes. A survey triggered by a churn-risk signal, a user who is reducing session frequency, has not completed a core action in 14 days, or has visited the account deletion screen, is the most commercially valuable in-app survey type. The user's answer to "What would help you get more value from this app?" at the moment of churn risk gives the team direct signal on why the churn is happening and what intervention might address it. A churn survey triggered just before uninstall gives the honest reason the user wouldn't bother emailing about. The timing is everything. The same question sent by email after the uninstall has already happened is survey data on why the product failed, not an intervention opportunity.
Preference capture. Surveys that collect zero-party data (explicit user preferences about what they want to see, what features matter to them, what their goals are) belong at onboarding and at milestone moments when the user's intent has shifted. A two-question preference survey at the moment a user's investment goal changes, or at the moment they first access a new product area, provides personalisation signal that behavioural data alone cannot produce. Zero-party data, information that users voluntarily share, is inherently compliant and more accurate than inferred preferences because it is declared rather than observed.
The Three Timing Moments That Produce the Highest Response Rates
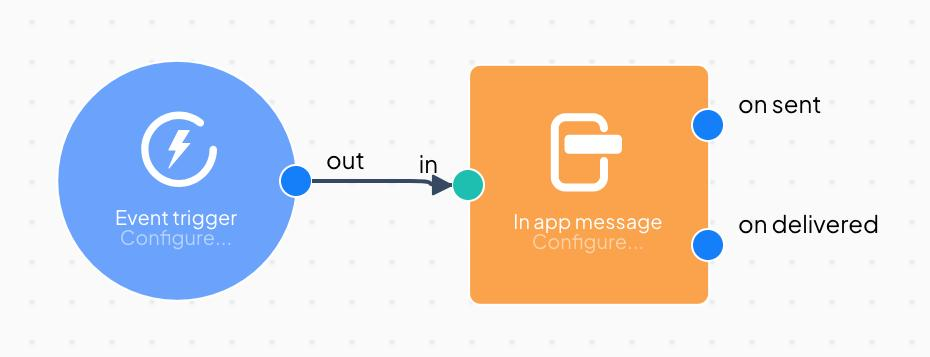
Survey timing is the variable that most directly affects both response rate and data quality. The same question, sent at the right moment versus the wrong moment, produces response rates that differ by 10 to 20 percentage points and data that differs in quality far beyond what the response rate difference suggests.
Immediately after completion of a key action. This is the highest-response-rate timing moment for most in-app survey types. The user just completed something meaningful: a transaction, an onboarding step, a milestone achievement, a first use of a new feature. Their experience is fresh, their engagement is high, and they have a natural moment of completion before moving to the next task. A survey appearing in this window is not an interruption. It is a continuation of the interaction. Feedback collected immediately after an experience scores 40% higher on actionability than delayed surveys, per the Event Marketing Institute's 2024 study. The recency of the experience is what makes the response specific and useful rather than reconstructed and general.
On a returning user's second or third session. New users are not ready to give meaningful feedback. They have not formed a real opinion of the product yet. An NPS survey deployed to a user who has been in the app for 30 minutes is capturing first impressions, not product sentiment. Trigger in-app NPS after at least three sessions, giving users enough time to form an opinion and reach an activation point. The second or third session user has enough experience to answer a loyalty or satisfaction question meaningfully and is recent enough that the experience is fresh. This is the optimal window for relational NPS and preference capture surveys.
At an engagement peak, not during struggle. Survey timing relative to the user's in-session emotional state matters more than most teams account for. A user who is encountering an error, struggling with a form, or in the middle of a multi-step task is not in a receptive state for a feedback question. The same user, immediately after successfully completing the task they came to do, is at an emotional high point and is far more likely to respond, and to respond accurately. The practical rule: never survey during an error state, during a transaction flow, or during any multi-step process the user has not yet completed. Survey at the completion moment or at a natural session pause, not at a friction point.
The Length Constraint: Why Three Questions Loses the Advantage

The single most consistent finding in in-app survey performance data is that length is the primary driver of completion rate degradation. Every extra question added beyond the first loses completion rate. Adding one or two extra questions can drop completion significantly. The in-app format's response rate advantage is built on the user's willingness to answer a quick question in context. That willingness is not elastic. It does not extend to a five-question survey just because the context is good.
The Refiner 2025 data identifies two performance peaks in in-app survey length: single-question surveys, and four to five question surveys. Single-question surveys perform well because completion is binary. A four to five question survey performs better than a two to three question survey in the specific case where the additional questions are logically connected and the user is genuinely invested in the topic. For most in-app use cases, the single-question format with one optional follow-up is the configuration that maximises both response rate and data quality.
The design principle: collect the minimum information needed to take a specific action. A two-question survey that asks the NPS question and then asks "What is the main reason for your score?" gives the team more actionable data than a two-question survey that asks NPS and then asks an unrelated feature satisfaction question. The follow-up must be logically connected to the primary question. An unconnected follow-up question reads as a survey that is longer than it needs to be rather than as a coherent feedback sequence.
Frequency is the other length problem. A user who receives a survey at every session stop engaging with them before the team notices. One survey per session. Thirty days between surveys for the same user. Two to three surveys per user per month at most. These are the boundaries between a survey program that users tolerate and one that erodes trust over time. Survey fatigue is cumulative and largely invisible until opt-out rates spike.
Design Decisions That Affect Response Rate
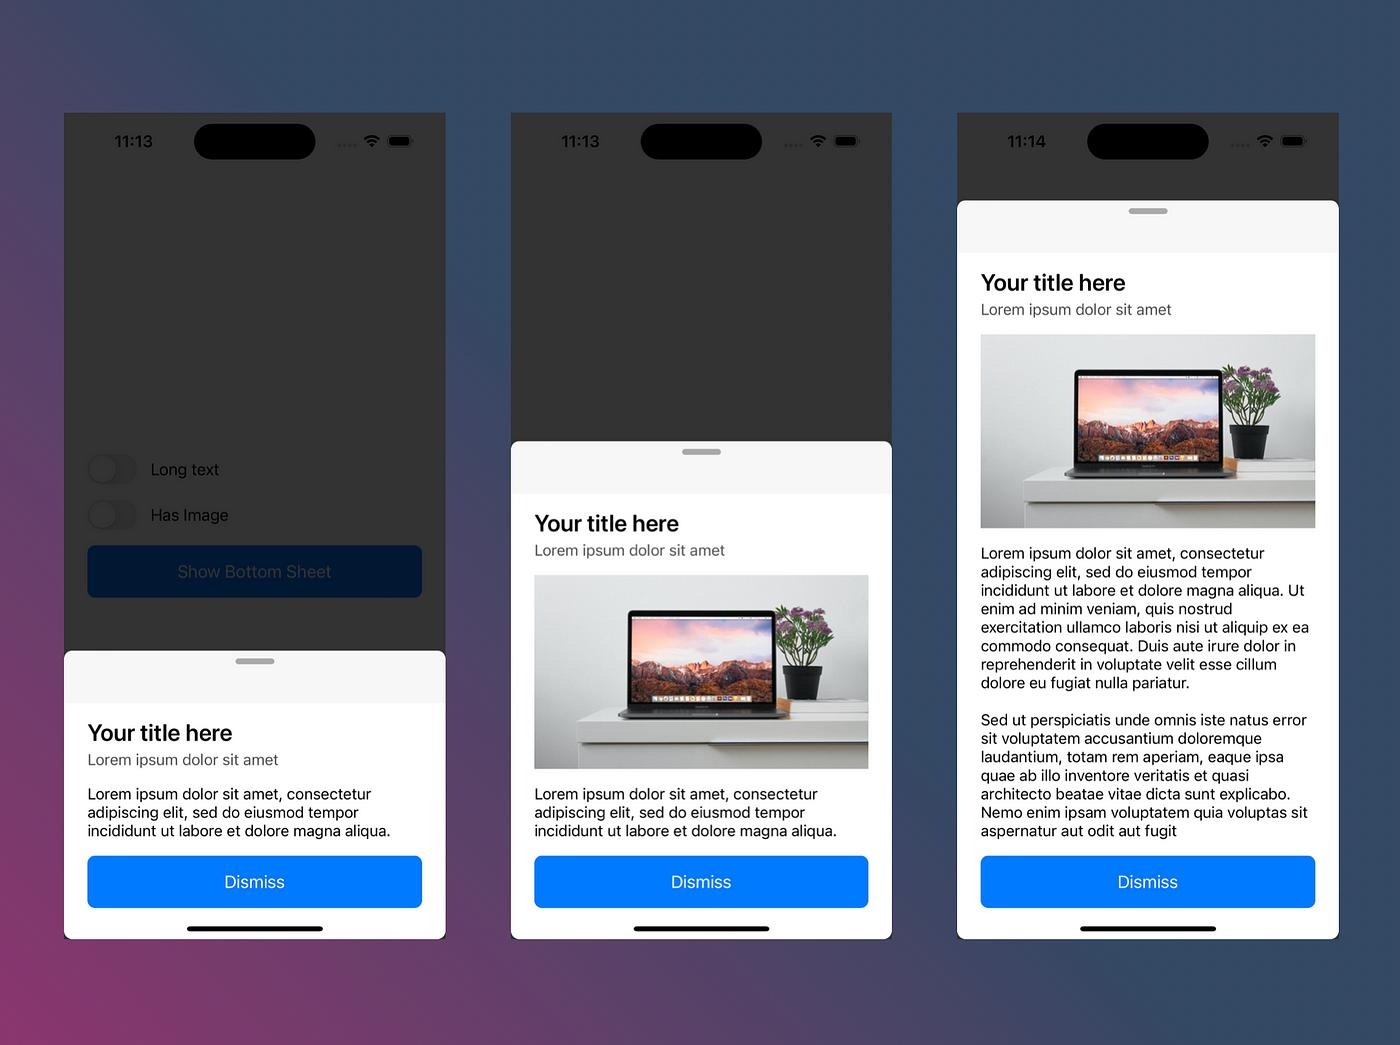
The format and visual design of the survey delivery mechanism affects response rate independently of the question content. Teams that optimise question writing without optimising delivery format are addressing the smaller variable.
Placement. In web apps, the center-screen modal produces the highest response rate at 42.6%. In mobile apps, the bottom-sheet placement outperforms other options and is the format most apps converge on, per Refiner's 2025 data. The bottom sheet is native to mobile interaction patterns. It appears from below, does not fully obscure the screen, and is dismissible without navigating away. It reads as a product element rather than an external overlay.
Hard dismiss versus soft dismiss. A hard dismiss (tap X, survey gone permanently) is appropriate for surveys that are not time-sensitive and where the user's opt-out should be respected without re-prompting. A soft dismiss (tap "Later," survey re-appears at next session) is appropriate for surveys that are genuinely time-limited: a feature feedback survey that will become irrelevant after 14 days benefits from a soft dismiss that gives the user a second opportunity without forcing completion. Hard dismiss produces lower completion rates in absolute terms but higher data quality in the responses it does collect, because the responders chose to answer rather than clearing a persistent prompt.
Progress indication. A progress indicator showing "Question 1 of 2" consistently improves completion rates on multi-question surveys compared to showing questions with no context. Users who know how much is left are more likely to finish. This effect is stronger for surveys of two or more questions. Single-question surveys do not need a progress indicator because completion is visible from the question itself.
Branching logic. A survey that adapts its follow-up question based on the user's first response collects better data and feels less generic. An NPS detractor (0 to 6) who receives "What is the main thing we could do better?" as a follow-up, while a promoter (9 to 10) receives "What is the thing you value most?", is being asked a question specific to their experience. The branching logic requires minimal additional configuration and produces dramatically more useful qualitative data than a single fixed follow-up question sent to all respondents.
Question Writing for In-App: The Rules That Actually Matter
A survey question that requires 15 seconds to read has already failed. The in-app survey format demands a different writing discipline from research survey writing. The goal is a question the user can read, understand, and answer in under 10 seconds.
Single topic per question. Every question must ask about one thing. "How satisfied were you with the speed and accuracy of the transaction?" is two questions disguised as one. The user cannot answer it accurately because their satisfaction with speed may differ from their satisfaction with accuracy. Separate the topics or choose the one that matters most for the decision the data will inform.
Plain language. Product team jargon does not belong in user-facing survey questions. "How would you rate the discoverability of the feature onboarding flow?" is a question about UX written in UX-team language. "How easy was it to find the investment setup guide?" is the same question in the user's language. The user's cognitive load is already being asked to process the survey on top of whatever they were doing. Plain language reduces that load.
Specificity over generality. "How was your experience today?" produces general sentiment that cannot be acted on. "How easy was it to complete your SIP today?" produces specific satisfaction data tied to a specific interaction that the product team can diagnose and improve. Specificity is what makes in-app survey data more actionable than email survey data, not just the response rate advantage.
Avoid leading questions. "We recently improved the checkout experience. How satisfied are you now?" primes the respondent to evaluate the checkout positively. The question has told them something was improved before they answered. The resulting data will skew positive not because the improvement worked but because the question implied it did.
The 30% Benchmark: What Reaching It Requires
A 30% response rate on an in-app survey in a mobile app is achievable but not the default. The median in-app mobile survey response rate in Refiner's 2025 dataset is 36%, but the average across all in-app surveys in the dataset is 27.52%. Reaching 30% requires the three conditions to be present simultaneously.
Right timing. The survey fires immediately after a completed key action, not at session start and not during a task in progress. Post-completion timing is the single highest-leverage timing decision.
Right length. The survey is one or two questions. The follow-up question, if present, is directly connected to the primary question by branching logic. There is no third question.
Right format. The survey appears as a bottom sheet on mobile, with a progress indicator if there are two questions, with a soft dismiss option for time-sensitive feedback, and with copy short enough to read in under 10 seconds.
Teams that hit all three conditions consistently land above 30%. Teams that miss one typically land at 15 to 20%. The most common miss is timing: surveys deployed at session start rather than post-action, or at a fixed schedule rather than an event trigger.
Closing the Loop: What Most Teams Skip
Closing the loop is the practice of acting on survey feedback and communicating that action back to users who provided it. It is also the practice most teams skip entirely, treating survey data as a data collection exercise rather than the beginning of a two-way conversation.
The commercial case for closing the loop is not abstract. Studies show that programmes that systematically close the loop with known customers improve retention and loyalty faster than those that do not. A user who gave a 4/10 NPS score and then received a follow-up in-app message explaining what the team did in response to the feedback they provided is a user who is being treated as a participant in product development rather than a respondent to a data collection exercise. That distinction changes the relationship.
The practical implementation has two parts. First, the routing: a low NPS score or a specific churn-risk survey response should automatically create a task for a team member who can follow up within 24 hours. Low scores that go into a dashboard without triggering any action are wasted data. A low score should automatically create a task for someone who can follow up within 24 hours, per Zonka Feedback's survey architecture guidance.
Second, the communication back to users who responded: when a feature improvement or product change was directly informed by survey feedback, a brief in-app message to users who gave that feedback ("You told us the SIP calculator was hard to find. We moved it to the home screen.") closes the loop explicitly. This message does not need to be long. It needs to connect what the user said to what the team did.
Digia Engage's survey module supports follow-up campaign triggers based on survey response values, which means a low NPS score can automatically trigger a follow-up in-app message or flag the user for a targeted retention campaign without manual review. The routing from survey response to follow-up action is part of the survey system, not a manual downstream process.
Topics Not in the Brief That Teams Should Know
Survey suppression during high-friction moments. The same suppression logic that prevents nudges from firing during transactions applies to surveys. A user mid-checkout, mid-KYC, or in the middle of a payment flow should never receive a survey. Survey suppression rules should mirror nudge suppression rules: any high-stakes session state is a suppression trigger. The full suppression framework covers which session states should block any in-app communication.
The bias toward extreme responders. Even with higher in-app response rates, the users who respond to surveys are not perfectly representative of the user population. Users with strong opinions, both positive and negative, are more likely to respond than users with neutral experiences. Teams building product decisions on survey data alone are building on a signal that is weighted toward the extremes. Pairing survey data with behavioural data (what users actually do, not just what they say) produces more accurate insight than either source in isolation.
Fintech-specific compliance considerations. In regulated financial apps, survey question content is subject to the same compliance constraints as marketing copy. A churn survey that asks "Are you leaving because of our interest rates?" or a satisfaction survey that refers to specific returns is potentially a regulated financial communication. Survey question content in fintech, insurance, and lending apps should be reviewed against the same compliance guidelines as in-app campaign copy.
The Digia Engage 30% benchmark. Digia Engage's in-app NPS surveys see a 30% or higher response rate compared to a 3% baseline for email surveys. The gap reflects the mobile-native, event-triggered delivery architecture. Surveys are configured and deployed from the same dashboard as nudges and gamification campaigns, with the same event-based trigger layer and audience filter capability.
Key Takeaways
Email surveys average 6% response rate in real-world B2C deployments. In-app mobile surveys average 36%. The gap comes from engagement context, reduced friction, and moment-of-truth proximity. All three contribute independently.
The five in-app survey types that produce actionable data are NPS, CSAT, feature feedback, churn-risk probes, and preference capture. Each has a specific trigger moment and a specific question format that matches it.
The three highest-response-rate timing moments are immediately after completing a key action, on the second or third session after install, and at engagement peaks rather than during friction or struggle. Never survey during a transaction flow, an error state, or a multi-step task in progress.
Surveys that exceed two questions lose the response rate advantage the in-app context provides. The optimal structure is a single primary question with one contextually connected follow-up based on the response. The follow-up question must be logically connected to the primary question, not an independent additional topic.
Reaching 30% requires right timing (post-action event trigger), right length (one to two questions), and right format (bottom sheet on mobile, progress indication, short copy, branching logic). Missing any one of these typically drops response rate to 15 to 20%.
Closing the loop, acting on low scores within 24 hours and communicating back to users what their feedback produced, improves retention faster than survey data collection alone and changes the user's relationship with the feedback process from reporting to participation.
Further Reading
From Digia Engage:
- Digia Engage Surveys — in-app survey module with event-based triggers, audience filters, branching logic, and follow-up campaign routing
- Privacy-First Personalization: Building Relevance Under iOS ATT, GDPR, and User Trust — zero-party data through preference surveys as the compliant personalisation signal
- When NOT to Show a Nudge: Building a Suppression Logic — suppression rules that apply equally to surveys and to nudges
- How to Know If Your Personalization Is Actually Working — using survey response data as a leading indicator alongside behavioural data
- Mobile App Retention Rate: What It Is and What's Pulling It Down — retention context for why churn-risk survey timing matters
External Sources:
- In-App Survey Response Rates (2025 Report) — Refiner (1,382 surveys, 5M views; mobile app 36.14% vs web 26.48%; CSAT 26.29% vs NPS 21.71%; placement data)
- In-App NPS Survey Guide — Refiner (timing strategies; three-session minimum; event-based trigger examples)
- In-App Surveys: Types, Questions, Best Practices and Examples — Zonka Feedback (survey frequency limits; routing from low scores to follow-up actions; churn survey timing)
- NPS Survey Response Rates: Benchmarks by Channel — Zonka Feedback (transactional vs. relational NPS response rate gap; channel comparison data)
- Average Survey Response Rate in 2025 — Clootrack (email baseline 6%; context is the determining variable; channel performance ranges)
- 10 Best Practices to Maximise NPS Survey Response Rates — Clootrack (closed-loop retention improvement; survey length impact on completion)
- Survey Response Rates: A Complete Guide to NPS and Post-Interaction Feedback — AskYazi (Delighted 2024 analysis; email 6% baseline; in-app immediacy advantage)
- 2025 Survey Response Rates Benchmarks — SurveySparrow (40% higher actionability for surveys within 2 hours of event; channel comparison table)
- 2025 Benchmark Report: What Is a Good Survey Response Rate? — Survicate (fintech and financial services median 44.10%; SaaS median 26.79%)
In-app surveys in Digia Engage fire from event-based triggers on the same architecture as nudges and gamification campaigns. NPS, CSAT, feature feedback, churn-risk probes, and preference surveys are all configurable from the dashboard with branching logic, response-based routing to follow-up campaigns, and audience filters by lifecycle stage or behaviour. Book a demo to see how the survey trigger and routing layer connects to your existing CleverTap or MoEngage segmentation, or explore the survey product page for the full configuration specification.