
TL;DR: Building a feature and shipping it is the easy part. Getting users to find it, use it, and keep using it is where most teams stall. The average feature adoption rate across mobile and SaaS products sits at 24.5%, and that number only counts users who tried the feature at least once. Progressive nudges attack the adoption problem in three distinct stages: show users the feature exists (in context, not in a tour they'll skip), show them how to use it at the moment their session signals they need it, and re-engage the ones who tried it once and went quiet. Each stage requires a different nudge format, a different trigger, and different success metrics. This article breaks all three down and covers exactly how to measure whether the sequence is working.
The Discovery Gap: Why Features Go Unused
Product teams operate on a quiet assumption: if a feature is built and lives inside the app, users will eventually find it. That assumption is wrong at a structural level, and the data has been consistent on this for years.
Pendo's product benchmark data puts the good feature adoption rate benchmark for B2B SaaS at 28%. Userpilot's benchmark report puts the average core adoption rate at 24.5%. Both figures refer to the percentage of active users who interact with a given feature at all. The majority of features in a product sit below this threshold permanently.
The root cause is not product quality. It is a well-documented cognitive phenomenon called feature blindness. Research by Appcues explains the mechanism: the human brain filters out information that isn't immediately relevant to the current task. At work, users change windows nearly 37 times an hour. Inside a mobile app, users are in a flow, completing a specific task, and that tunnel focus means they routinely walk past features that would genuinely help them. They are not ignoring features because the features are bad. They are ignoring them the same way they ignore advertising, by not registering that they exist.
The problem compounds when teams try to solve it with onboarding tours. A standard onboarding flow introduces five to ten features to a user who has just signed up, has no context for why any of those features matter, and whose only goal is to reach the first value moment as fast as possible. Product teams consistently report that tutorial overload at onboarding buries the actual product rather than surfacing it. Users skip the tour. The features remain undiscovered.
The alternative is not better tours. It is context-driven nudges that arrive at the moment a user's behavior signals they are ready for a specific feature, at a specific point in their session, for a specific reason.
That is the premise behind progressive nudge design. The timing is behavioral, not calendar-based. The content is contextual, not generic. The sequence is layered across three stages, each with a different goal.
What "Progressive" Actually Means in Nudge Design
The word progressive in this context has a precise meaning. It refers to nudges that match the user's current relationship with a feature: first exposure, first use, and reinforced habit. A user who has never seen a feature needs a different nudge than a user who tried it once and drifted. Treating both with the same message is the most common failure mode in feature adoption campaigns.
The three stages map onto a user's journey through a specific feature:
Stage 1: Awareness. The user does not know the feature exists, or has not connected it to the problem they have right now. The nudge goal is surface recognition, not usage. Getting the user to notice that the feature is there.
Stage 2: Education. The user has noticed the feature or clicked on it, but has not completed a meaningful first use. The nudge goal is guided first action, reducing the friction between curiosity and completion.
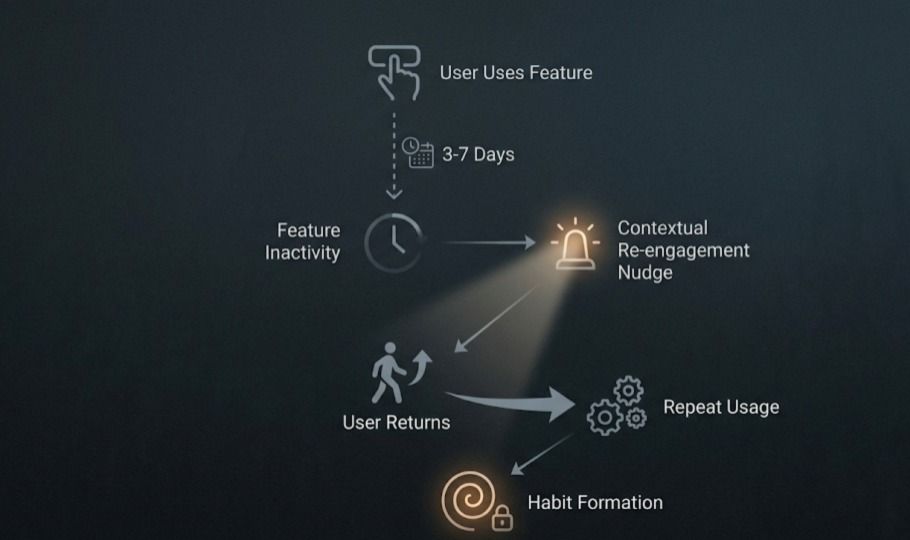
Stage 3: Re-engagement. The user completed first use but did not return. The nudge goal is habit reinforcement, bringing them back at the moment their workflow intersects with the feature again.
Each stage breaks down differently in terms of trigger logic, format, and measurement. Conflating them is what turns a nudge sequence into noise.
Stage 1: Showing the Feature Exists
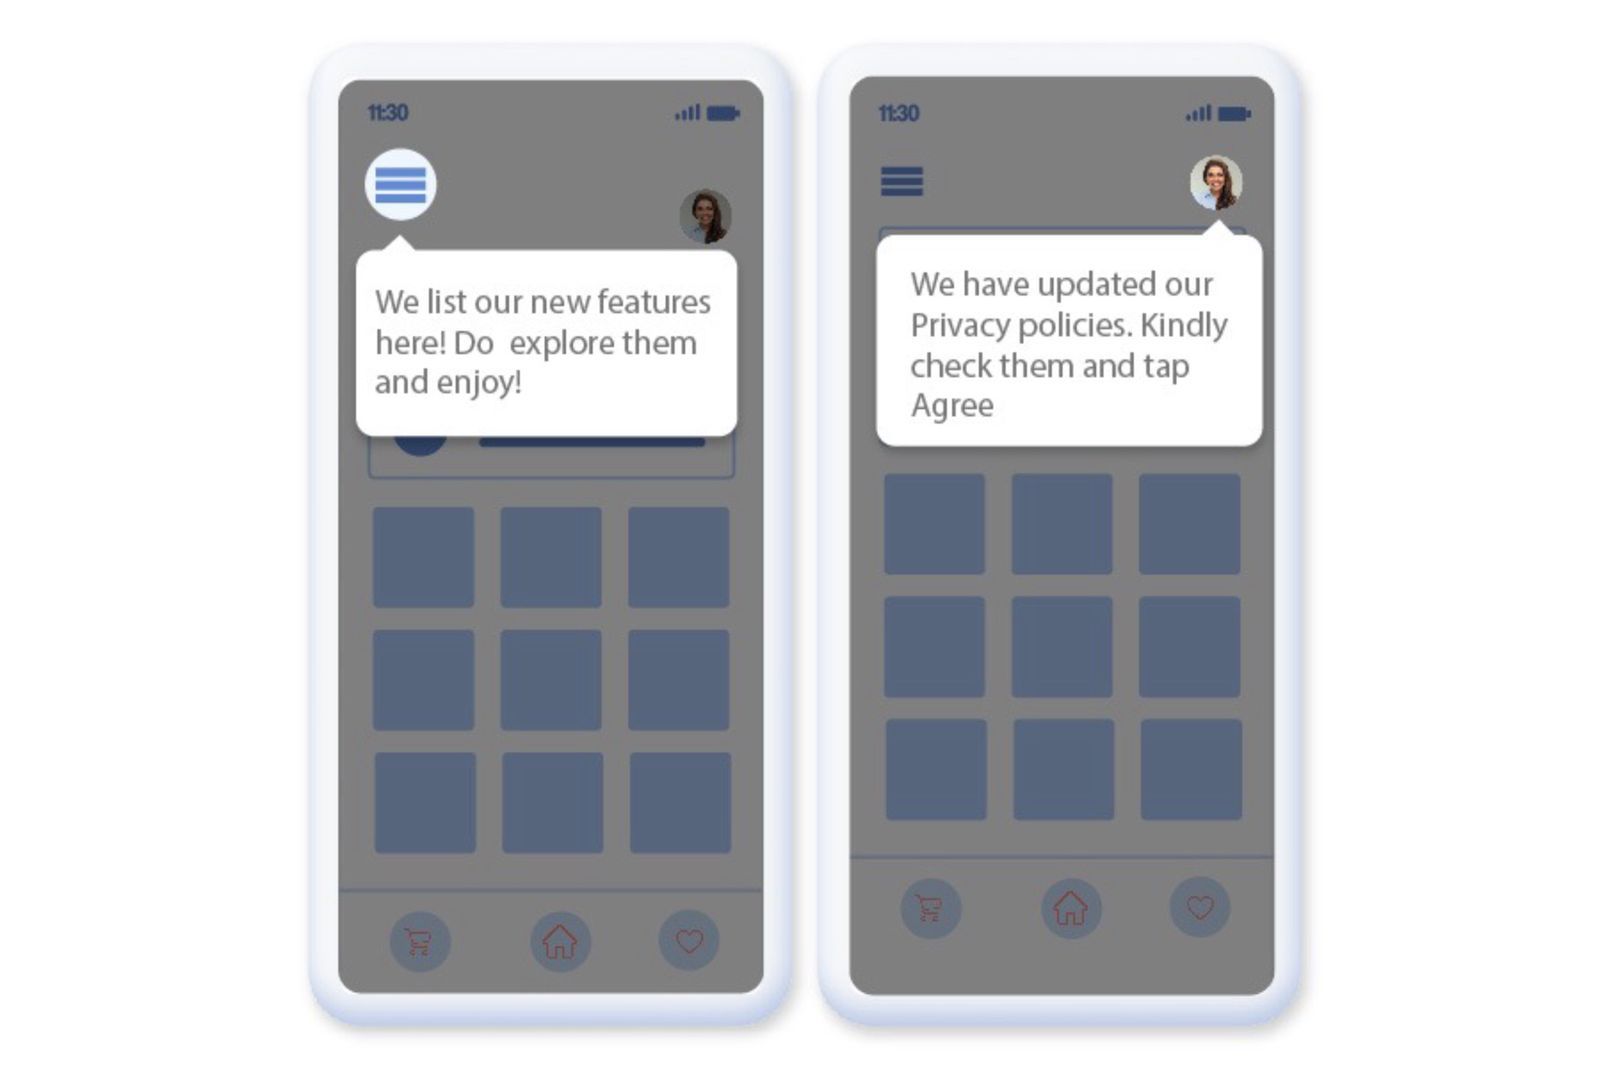
The most common awareness nudge is the worst one: a banner on the home screen that says "New: [Feature Name] is now available." It appears at app open, before the user has any session context, and competes for attention with whatever brought them to the app in the first place. Most users dismiss it in under two seconds.
Effective awareness nudges share one property: they appear on the correct screen, at the correct point in the user's flow, with copy derived from what the user is currently doing.
Research published in the Journal of Marketing Science covering six preregistered experiments and a field experiment with 594,997 participants found that choice architecture interventions, including how feature decisions are sequenced and framed, dramatically increased app feature adoption. The wording and placement variables mattered more than the existence of the notification itself.
That points to a specific design rule for Stage 1 nudges: the trigger must be behavioral, and the copy must reference the user's current context. A few patterns that work:
Proximity trigger. The nudge appears when the user is on a screen adjacent to the feature. A fintech app user viewing transaction history sees a tooltip spotlighting the analytics dashboard button. Not at app open. Not in their inbox. On the screen where the feature is one tap away.
Task-completion trigger. The nudge appears immediately after the user completes an action that the feature would extend. A user exports a report and then sees a spotlight on the scheduled export feature. They have just demonstrated the need. The nudge arrives while that need is fresh.
Gap-detection trigger. The nudge appears when a user attempts something manually that a feature would automate. A user manually filters a list for the third time and a tooltip surfaces the saved filters feature. The pattern of behavior is the trigger.
In-app nudge research from Plotline confirms the core principle: users do not have short attention spans, they have short consideration spans. The window for a Stage 1 nudge to land is narrow. An idle 8-second window inside the app can serve as an awareness trigger. Anything that fires outside the session context or before the user is in a task state has a much lower chance of being processed.
For format, spotlight nudges and coach marks work best at Stage 1. They point to the feature without forcing the user to stop their primary task. A spotlight dims the surrounding UI and highlights the feature element. A coach mark adds a short label explaining what it does. Both are dismissible with a single tap and do not block the user's flow.
Social proof variants at Stage 1 consistently outperform generic announcements. "12 of your teammates already use this feature" produces 20 to 40% lift in adoption compared to a generic feature announcement, according to data from Slack's workspace expansion nudge patterns. The social signal reduces the cognitive cost of evaluating something new: if others in the user's context are already using it, the evaluation barrier drops.
Stage 2: Showing How to Use It
Stage 2 begins the moment a user acknowledges the Stage 1 nudge or navigates to the feature independently. The distinction that matters here: Stage 2 is not a continuation of the tour. It is a guided first action sequence triggered by the user's own behavior.
The failure mode at Stage 2 is educational overload. The instinct in most product teams is to explain everything about a feature the first time a user lands on it. A modal appears listing all the things the feature can do. The user, who wanted to try one specific thing, now has to process a capability list before they can do anything. Many close the modal and leave.
The correct framing for Stage 2 is completion of one action, not comprehension of all actions.
Behavioral research on feature activation shows that users who activate a feature within 5 minutes of first exposure show 67% higher repeat usage rates compared to users who take 30 or more minutes to activate. The implication is direct: the faster a user completes a meaningful first action inside a feature, the more likely they are to return. Stage 2 nudges should accelerate that first action, not add friction to it.
The nudge formats that work at Stage 2 are in-line tooltips that appear next to the specific element the user needs to interact with next, and step-by-step spotlights that reveal one step at a time only after the user completes the previous step. Both of these prevent overwhelm while keeping the user in the product.
Content rules for Stage 2 nudges:
The copy should describe the next action, not the feature's full value. "Tap here to apply your first filter" converts better than "With the advanced filtering system, you can create, save, and share custom filters across your team." The first copy gets the user one step closer to completion. The second requires the user to read before they can do anything.
The nudge should disappear the moment the user takes the described action. If a tooltip instructing "Tap here" stays on screen after the user taps, it creates visual noise and signals that the product is not tracking their actions. Contextual nudges that respond to what users actually do, appearing and disappearing based on real-time session events, convert at a meaningfully higher rate than static overlays.
According to research from Chameleon, contextual in-app announcements and guidance drive 3 to 5 times higher feature adoption compared to email announcements alone. The in-product context is not just a delivery channel; it is the reason the message lands. Users inside the app are in a task state. Email reaches them outside that state, which means the information has to survive a context switch before it becomes actionable.
Timing the First Nudge: After Which User Action?
Timing is the variable that determines whether a nudge feels helpful or intrusive. Most teams get it wrong by defaulting to calendar-based triggers: show the feature nudge on Day 3. Show the re-engagement nudge on Day 7. These schedules produce nudges that arrive regardless of whether the user is in a session state where the feature is relevant.
The question is not "when in the user's lifecycle do we show the nudge?" The question is "after which user action does this feature become relevant for this user?"
That question produces behavioral triggers, and behavioral triggers consistently outperform calendar triggers for feature education. A few frameworks for identifying the correct trigger moment:
The prerequisite action. Some features only make sense after a user has completed a related action first. A savings goal feature in a fintech app only makes sense after a user has linked a bank account. The awareness nudge for savings goals should trigger on the session after account linking, not on Day 3 of the user lifecycle. The user has the prerequisite in place. The feature is now relevant.
The repeated manual pattern. When a user does the same thing manually three or more times, they have demonstrated a need that a feature could meet. That repetition is the trigger. A user who has opened the same filter settings manually three sessions in a row is a precisely correct audience for a saved filters nudge. They have proven the use case by their own behavior.
The first frustration signal. Some platforms can detect when a user has spent an unusual amount of time on a step or has tapped back from a screen without completing an action. That behavioral signal is a trigger for a help-oriented Stage 2 nudge, not a sales-oriented Stage 1 nudge. The user is stuck. The correct response is task assistance, not feature promotion.
Data from product analytics research shows that high-performing products achieve a median time-to-first-use of 2 to 5 days for strategic features, while products that rely on menu-based discovery alone see median times of 14 to 21 days. Each additional day of delay reduces the probability of eventual adoption by approximately 3 to 5%. The difference between behavioral triggers and passive discovery is roughly 10 to 16 days of time-to-first-use, and that gap compounds directly into long-term feature retention rates.
The post-onboarding moment. Onboarding introduces the core flow. The session after onboarding, when a user returns for a second visit with the core flow understood, is the correct moment to begin surfacing adjacent features. Users in their second session have established a baseline mental model of the product. A feature nudge at this point has context to anchor to. The same nudge in the first session competes with everything else the user is trying to understand.
Appcues' feature adoption guide makes the distinction clearly: discovery without adoption means something is broken. The trigger timing is often the broken part. A user discovers a feature when the nudge fires. Adoption fails when the nudge fires at a session moment where the user has no immediate reason to act on it.
The Re-Engagement Layer: Stage 3
Stage 3 addresses a specific cohort that most teams either ignore or treat incorrectly: users who found the feature, tried it once, and never returned. This cohort is not the same as users who never found the feature. Treating them with the same awareness nudge (Stage 1) is the single most common error in feature re-engagement campaigns.
A user who tried a feature once already passed Stage 1 and Stage 2. Their drop-off is not a discovery problem. It is either a value-clarity problem (the feature did not immediately deliver an outcome worth repeating) or a habit-formation problem (the feature did not integrate into their existing session patterns naturally). The re-engagement nudge needs to address one of those two root causes, not re-introduce the feature as if it is new.
For value-clarity drop-off, the re-engagement nudge surfaces a specific outcome the user did not reach in their first session. A user who set up a dashboard but never acted on any of the data in it sees a nudge that references a specific insight now available in their dashboard, derived from their own data. The nudge is not "You haven't tried your dashboard in 7 days." That copy addresses the behavior (absence) rather than the value (what they're missing). The more effective version is "Your top metric moved 15% this week. Check the dashboard." The second nudge connects the feature to a result that is relevant to the user's actual situation.
For habit-formation drop-off, the re-engagement nudge arrives at the exact workflow moment where the feature should have been used but was not. If analytics data shows that a user consistently completes action A and action B in the same session, and the feature should fire between those two actions, the trigger for the Stage 3 nudge is action A. The user is about to go through their workflow. The nudge intercepts that workflow at the precise point where the feature adds value.
Research on re-engagement timing from Appcues confirms the window is narrow: automated triggers for early-stage dormancy produce 2 to 3 times higher return rates than waiting a week or more. The window to recover a lapsing user closes within 3 to 7 days. After 7 days of feature inactivity, the probability of return drops sharply. This is not a push notification problem. Push notifications reach users outside the app, where they have no session context. The highest-impact Stage 3 nudge is an in-app message that fires when the user opens the app after a period of feature inactivity, within their first 60 seconds of that session, before they fall into their default usage pattern.
Three re-engagement nudge patterns that work:
The "What you built last time" pattern shows the user the output they created during their first use. A project created, a goal set, a filter saved. The nudge references the specific artifact, not the feature generically. "Your budget goal from last week is 3 days from its deadline." This makes the re-engagement feel relevant rather than automated.
The "Others at your stage are doing X" pattern uses peer behavior as the trigger. Social proof data consistently moves users through re-engagement at significantly higher rates than generic re-engagement copy. "Users who used this feature 3+ times in their first week retained at 2x the rate" is both accurate and motivating for a user who completed only one session with the feature.
The "You're close to [outcome]" pattern applies progress framing to re-engagement. If a feature has a completion state (a profile, a setup flow, a configuration), a nudge that names the specific completion gap ("2 more steps to activate your personalized alerts") activates progress bias. Users are more likely to complete something they started than to start something new. The re-engagement nudge positions returning as completion rather than repetition.
Measuring Nudge Effectiveness
Running a progressive nudge sequence without measuring the right metrics produces one of two outcomes: the team concludes the nudges are working because impression counts look good, or the team concludes the nudges are not working because overall feature adoption is still low. Both conclusions can be wrong, because neither maps to the actual question: which nudge, at which stage, is failing?
Feature re-engagement directly influences retention outcomes. Users who return after first use are more likely to develop lasting habits, improving retention and long-term customer value.
The measurement framework for a three-stage nudge sequence requires four distinct metrics, each assigned to the stage it diagnoses.
Metric 1: Awareness rate (Stage 1). The percentage of users who were shown a Stage 1 nudge and subsequently navigated to the feature within that session or the following session. This is not impression count. This is conversion from nudge exposure to feature visit. A low awareness rate means the Stage 1 nudge format, placement, or trigger is wrong. The user saw it and did nothing. Fix the trigger or the format before moving on.
Metric 2: First-use completion rate (Stage 2). The percentage of users who visited the feature and completed a meaningful first action. Benchmark data from SaaS research puts well-designed features at 40 to 60% activation rates. Rates below 30% typically indicate onboarding friction or an unclear value proposition in the Stage 2 nudge copy. A user who arrives at the feature but does not complete first use is a Stage 2 problem, not a Stage 1 problem. The solution is different accordingly.
Metric 3: Return rate (Stage 3 effectiveness). The percentage of users who completed first use and returned to the feature within 7 days. Mixpanel's product engagement research finds that users with 3 or more first-week feature interactions show 2.4 times higher 90-day retention rates than users with a single interaction. The 7-day window is the critical measurement period. If a user returns within 7 days of first use, habit formation is beginning. If they do not, the feature's value delivery failed to pull them back on its own and the Stage 3 re-engagement sequence needs to fire.
Metric 4: 7-day feature retention rate. The percentage of users who used a feature in a given week and returned to it in the following week. This is the ultimate measure of whether a nudge sequence has converted first use into habit. Early feature adoption data shows that feature adoption in the first month leads to 30% better overall retention at the 6-month mark. The 7-day feature retention rate is the leading indicator of that outcome, and it is the metric that tells you whether the full nudge sequence is working end to end.
The most common measurement error is tracking only feature adoption rate without tracking which stage of the nudge sequence produced it. Aggregate adoption rate conceals whether a Stage 1 problem, a Stage 2 problem, or a Stage 3 problem is the limiting factor. Userpilot's diagnostic framework makes this explicit: start with breadth (is the feature being discovered?). If breadth is low, everything downstream will suffer. Healthy breadth paired with low adoption means the problem is between first exposure and consistent use. Diagnose the stage before changing the nudge.
Key Takeaways
- The average feature adoption rate across consumer apps and SaaS products sits at 24.5%. The root cause in most cases is feature blindness, not product quality. Users filter out features that are not immediately relevant to their current task, and a launch announcement or onboarding tour does not override that filter.
- Progressive nudge design runs three distinct stages. Stage 1 surfaces the feature in context. Stage 2 guides first use at the moment of interest. Stage 3 re-engages users who tried the feature once and did not return. Each stage needs different triggers, different formats, and different success metrics.
- The most effective Stage 1 nudge format is a behavioral trigger, not a calendar trigger. Proximity triggers (user is on a screen adjacent to the feature), task-completion triggers (user just did something the feature extends), and repeated-manual-pattern triggers (user has done something manually 3+ times that a feature would automate) all outperform day-of-lifecycle triggers.
- Social proof at Stage 1 lifts adoption by 20 to 40% compared to generic feature announcements. "12 of your teammates already use this" processes faster and converts better than "New: Feature X is now available."
- The timing gap between behavioral triggers and passive discovery is 10 to 16 days. Each additional day of delay in reaching first use reduces the probability of eventual adoption by approximately 3 to 5%.
- Users who complete first use within 5 minutes of exposure show 67% higher repeat usage rates than users who take 30 or more minutes. Stage 2 nudges should guide completion of one action, not comprehension of all actions.
- The re-engagement window closes within 3 to 7 days of feature inactivity. Automated in-app triggers for early-stage dormancy produce 2 to 3 times higher return rates than waiting beyond the 7-day mark.
- Measuring only aggregate feature adoption rate hides which stage of the sequence is failing. Measure awareness rate (Stage 1), first-use completion rate (Stage 2), 7-day return rate (Stage 3), and 7-day feature retention rate (habit formation).
Further Reading
From Digia Engage
In-App Nudges covers the full range of nudge formats available, from tooltips and coach marks to spotlight overlays and persistent banners, all triggerable by real-time user events without requiring an app release.
Feature Adoption Use Case explains how Digia Engage's in-app campaign layer maps onto the full adoption funnel, from first-exposure nudges to re-engagement sequences.
Inline Widgets covers how content blocks can be embedded at any screen position inside an app without modifying the app binary, enabling the contextual placement patterns that make Stage 1 nudges effective.
In-App Surveys explains how post-feature-use surveys capture the feedback that diagnoses why users with low Stage 2 completion rates are dropping off, helping teams fix the right thing.
Zomato's Inline Banner Strategy for Upsell Flows shows a detailed real-world application of contextual in-product nudges that surface at high-intent session moments rather than as modal interruptions.
Book a product demo to see nudge trigger configuration, behavioral event setup, and the full Stage 1 to Stage 3 sequence built live inside the Digia Engage dashboard.
External Sources
Userpilot: Feature Adoption Metrics provides the diagnostic framework for separating breadth, depth, and duration problems in feature adoption funnels, including benchmark data from 547 SaaS companies.
Appcues: Feature Blindness and App Retention explains the cognitive mechanism behind why users miss features in products they actively use, and what counterstrategies work.
Journal of Marketing Science: Nudging App Adoption covers six preregistered experiments and a field experiment with 594,997 participants showing that choice architecture, wording, and color choices in feature adoption nudges dramatically change adoption outcomes.
Appcues: App Retention Benchmarks 2026 covers the 3-to-7-day re-engagement window, automated trigger data, and the industry benchmarks for Day 1, Day 7, and Day 30 mobile app retention.
Plotline: In-App Nudge Guide 2026 covers nudge formats, timing strategies, and the behavioral principles behind why in-app nudges outperform push notifications for feature education.
SaasFactor: Measuring Feature Adoption includes the activation rate benchmarks, time-to-first-use data, and the 67% repeat usage finding for users who activate within 5 minutes of first exposure.
Digia Engage is a no-code in-app campaign platform for mobile product and growth teams. It supports behavioral event triggers, multi-stage nudge sequences, inline widget injection, and feature adoption analytics, all managed from a single dashboard without requiring app releases. SDK integration takes under 20 minutes. See the feature adoption use case in the platform.