




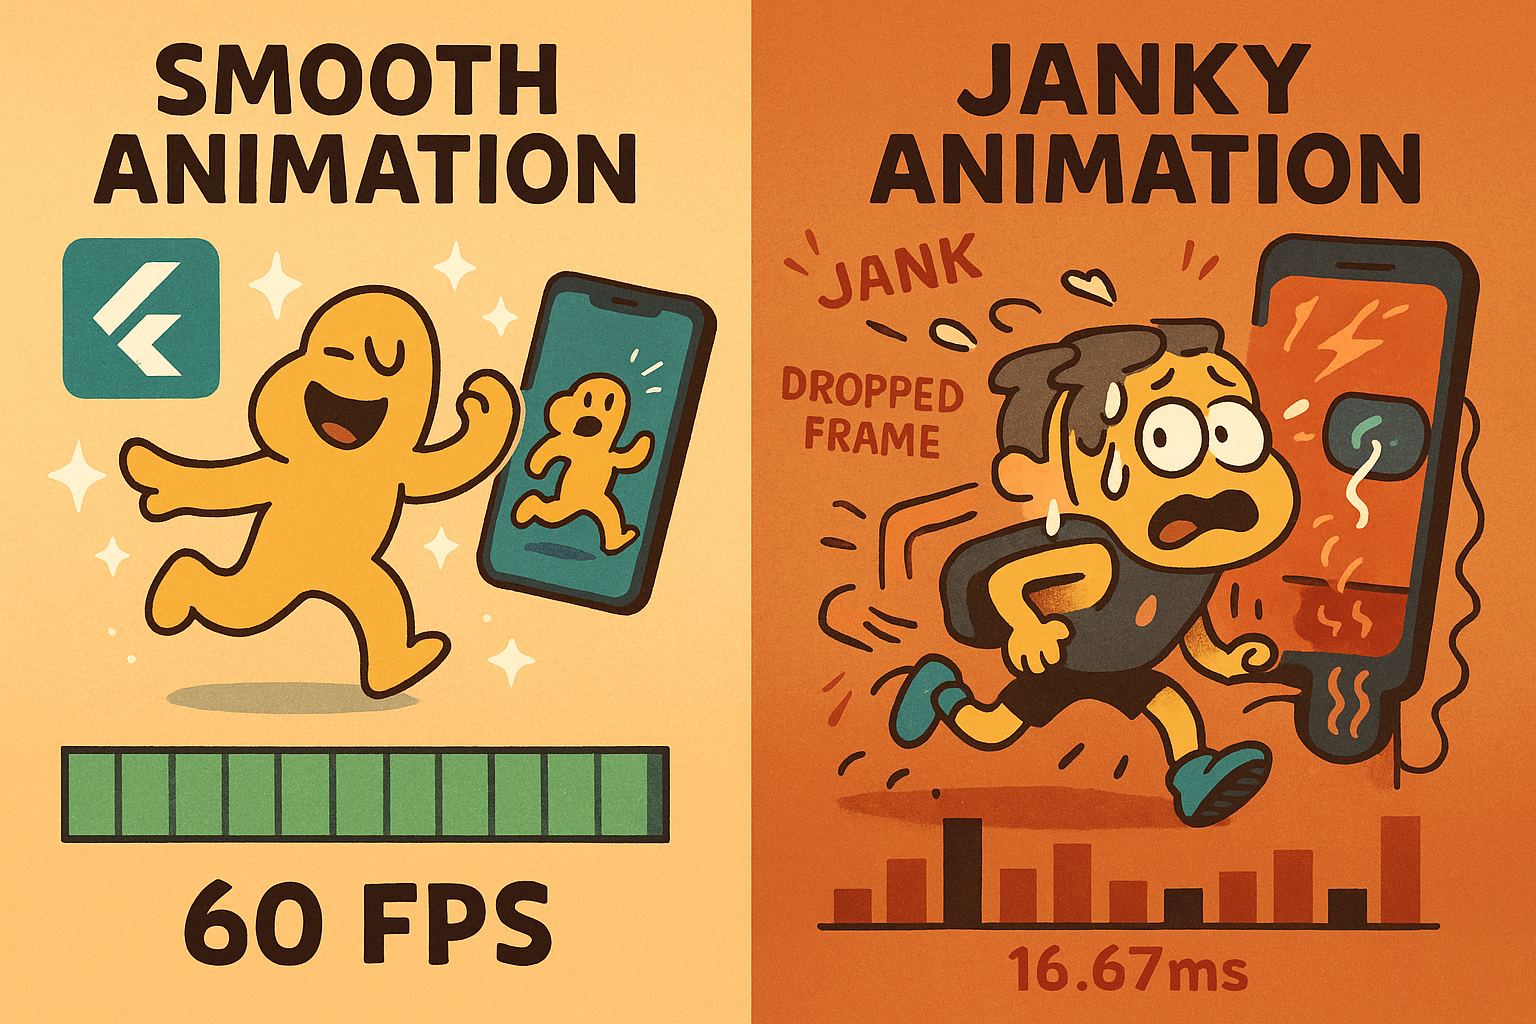
Have you noticed how a single stutter in an animation instantly makes the whole app feel slower?
Motion is one of the strongest signals users pick up unconsciously. Flutter apps rely on animations to guide attention, shape hierarchy, and communicate progress. But when those animations lag even slightly, the entire product feels less responsive, regardless of how fast the backend is or how optimized the code may be.
Delivering consistent 60 FPS animations requires rendering each frame in under 16.67 milliseconds. That demand exposes inefficiencies in rebuilds, layout computation, memory usage, and rendering workloads. Flutter provides powerful primitives for building high-performance animations, but achieving smooth motion consistently across devices, screen densities, and UI states requires deliberate engineering.
This article outlines the core principles, diagnostic processes, and optimization techniques teams rely on to ensure animation performance at scale. It then examines how server-driven UI tools like Digia simplify iterative improvements by removing update bottlenecks.
TL;DR
- Smooth animations require consistent 60 FPS and frame times under 16.67ms
- Most jank comes from excessive rebuilds, repaints, and heavy layouts
- Use tools like AnimatedBuilder and RepaintBoundary to isolate updates
- Diagnose issues with Flutter DevTools (UI thread, GPU, raster, memory)
- Lazy animation strategies and controller management improve scalability
- Server-driven UI tools like Digia enable instant performance fixes without rebuilds
Why Animation Performance Matters
Animation performance is directly correlated with user perception of quality. Even if your business logic and network performance are optimal, a stuttering animation creates friction that users immediately notice.
Poorly performing animations typically manifest as:
- frame jank
- inconsistent frame timings
- delayed transitions
- visible layout shifts
- increased device heat and battery drain
These issues compound in complex interfaces like scrolling lists, tab transitions, interactive components, onboarding flows, where multiple animations run concurrently.
The objective is simple: Maintain stable frame pacing under 16.67ms per frame on every device class.
Achieving this requires understanding what Flutter builds, what it repaints, and what it composites across the widget tree.
| Aspect | Smooth Animations | Janky Animations |
|---|---|---|
| Frame Timing | Stable under 16.67ms | Frequent spikes above budget |
| User Perception | Fast and responsive | Slow and unpolished |
| Rendering Load | Optimized and scoped | Excessive rebuilds/repaints |
Optimizing Widget Rebuilds
Large-scale widget rebuilds are the most common cause of animation jank. Flutter’s rendering pipeline is efficient, but only when rebuilds are scoped narrowly.
The goal is to animate only the components that genuinely need to change.
Use AnimatedBuilder for granular updates
Instead of rebuilding entire widget hierarchies inside setState(), use AnimatedBuilder to target specific subtrees.
AnimatedBuilder(
  animation: controller,
  builder: (context, child) {
    return Transform.scale(
      scale: controller.value,
      child: child,
    );
  },
  child: const Icon(Icons.favorite),
)
Here, child remains stable and is not rebuilt during each animation tick.
Wrap animated regions in RepaintBoundary
RepaintBoundary isolates a subtree, preventing unrelated parts of the UI from repainting when an animation updates.
Use ValueListenableBuilder for non-animation updates
This widget provides localized rebuilds for state changes that would otherwise trigger unnecessary tree updates.
These patterns ensure the animation loop focuses only on what is required, reducing layout and painting loads.
| Approach | Full Rebuilds | Scoped Updates |
|---|---|---|
| Performance | Poor under animation load | Highly efficient |
| Rebuild Scope | Entire widget tree | Targeted subtrees |
| Frame Stability | Inconsistent | Stable |
Using Animation Packages Efficiently
Flutter’s built-in tools cover most animation workflows, but specialized packages support advanced use cases.
Lottie
Efficient vector animations, useful for onboarding, empty states, and micro-interactions.
Rive
Highly interactive, state-machine-driven animations with low runtime overhead.
To maintain performance:
- minimize the number of layers
- remove unnecessary vector complexity
- reuse controllers where possible
- test final animations on lower-end devices
Even high-quality animations degrade when layers or nodes exceed device capabilities.
Lazy Animation Strategies
Not all animations need to run at all times. Managing visibility and execution scope reduces workload significantly.
Viewport-based animation triggering
Tools like VisibilityDetector enable animations only when widgets are visible.
Staggered animations
Staggering reduces simultaneous computation and avoids load spikes.
Animation pooling
In list or grid views with numerous similar animated elements, reuse a limited pool of controllers rather than instantiating dozens.
Scroll-aware animation widgets
Use SliverAnimatedList, AnimatedList, and similar widgets for performance-optimized transitions tied to scrolling.
Lazy animation techniques ensure that animation cost scales logically with what the user sees, not what the interface contains.
Diagnosing & Fixing Animation Bottlenecks
Even well-architected animations require diagnostics. Flutter provides mature tooling for identifying bottlenecks.
Using Flutter DevTools Effectively
Performance tab
Displays:
- frame rendering time
- UI and GPU thread workload
- shader compilation events
- rebuild hotspots
Spikes or consistently tall UI-thread bars indicate rebuild pressure or heavy parsing tasks during animation.
Performance overlay
Real-time GPU/UI thread graphs reveal:
- dropped frames
- inconsistent frame pacing
- rasterization delays
Red bars mean frames missed the 16.67ms deadline.
Raster view
Shows repaint activity and helps identify areas triggering heavy repaints.
Memory tab
Useful for catching:
- animation controller leaks
- unbounded list constructions
- resource load spikes
If animation performance degrades over session length, memory pressure is often the cause.
Common Signs of Performance Issues
- Jank - frames taking longer than 16.67ms
- Dropped frames - visible in the performance overlay
- Inconsistent frame pacing - animations appear uneven despite reasonable averages
- Heat/battery spikes - CPU/GPU overutilization
- Slow scrolling - large rebuilds or expensive layouts on scroll events
Spotting these signs early prevents regressions from accumulating.
Quick Wins for Immediate Performance Gains
Several changes provide high-impact improvements across animation-heavy interfaces.
1. Use const constructors aggressively
Static widget trees reduce rebuild frequency dramatically.
2. Dispose animation controllers correctly
Unreleased controllers create memory leaks and runaway CPU usage.
3. Isolate animation-heavy components
Use RepaintBoundary and modular widget design.
4. Preload images and assets
Avoid animation stalls caused by late asset decoding.
5. Avoid implicit expensive operations
Heavy computations inside build() or animation listeners should be moved out.
These adjustments often eliminate the majority of animation jank in real applications.
Advanced Techniques for High-Performance Animations
When building animation-heavy applications like finance dashboards, gamified flows, marketplaces, onboarding systems, higher-level optimizations matter.
Isolate high-frequency updates
Any widget that updates dozens of times per second should be isolated to its own repaint layer.
Optimize scrolling animations
Ensure your scroll listeners are lightweight. Avoid coupling scroll signals to large state updates.
Reuse animation controllers strategically
Pooling prevents unnecessary allocations and runtime overhead.
Prefer precomputed transforms
Avoid recalculating matrices or expensive layout values inside animation ticks.
High-performance animation systems are built by balancing lifecycle control, rendering efficiency, and modular UI design.
How Digia Simplifies Animation Performance in Production
Building high-performance animations is only half of the challenge. Deploying performance improvements reliably becomes equally important at scale.
Most teams face friction here:
- animation fixes require rebuilds
- app store approvals delay improvements
- user adoption may lag weeks behind
- regressions may persist until rollout thresholds are met
Digia Studio removes these constraints entirely.
Instant Deployment with Server-Driven UI
Any animation adjustment for example - timing curve, easing function, sequence, opacity, transform, they can be shipped instantly without a rebuild.
Design → Preview → Release → Live with 100% user adoption on day one.
This allows teams to:
- iterate on motion timing
- refine animation-triggering logic
- adjust performance-sensitive interactions
- run A/B performance tests across user segments
- deploy fixes to jank in minutes
The feedback loop becomes drastically faster.
Pre-Optimized Animation Components
Digia provides motion components built with performance best practices:
- isolated repaint regions
- optimized curves
- predictable transforms
- clean lifecycle management
This reduces the margin of error for animation-heavy features, especially in large teams or fast iteration cycles.
Enterprise-Grade Infrastructure for Motion-Intensive Apps
High-traffic applications with complex interactions benefit from Digia’s underlying infrastructure:
- Git-based versioning
- role-based access control
- ISO 27001 certified data systems
- reliable global schema delivery
Animation improvements remain consistent across all environments and devices.
How to Systematically Optimize Flutter Animations
- Measure Current Performance
Use DevTools to identify frame drops, UI thread spikes, and repaint hotspots. - Identify Rebuild Issues
Locate widgets rebuilding unnecessarily during animation cycles. - Isolate Animated Regions
Apply RepaintBoundary and modular widget design. - Optimize Animation Logic
Replace setState() with AnimatedBuilder or ValueListenableBuilder where possible. - Reduce Rendering Complexity
Simplify layouts, minimize layers, and optimize vector assets. - Apply Lazy Animation Strategies
Trigger animations only when visible and stagger heavy sequences. - Test Across Device Tiers
Validate performance on low-end devices and under poor network conditions. - Continuously Monitor and Iterate
Use performance tools regularly and refine animations based on real usage.
Methodology
This article is based on:
- Analysis of Flutter’s rendering pipeline and animation lifecycle
- Practical performance debugging using Flutter DevTools
- Observations of animation behavior across different device classes and UI complexities
- Evaluation of real-world optimization strategies used in production Flutter apps
The goal is to explain not just what causes animation jank, but how teams can systematically diagnose, optimize, and maintain smooth motion at scale.
Conclusion: Delivering Smooth, Predictable Motion in Flutter
High-performance animations are not optional, they’re foundational to modern mobile UX. Smooth transitions influence perceived speed, engagement, and user trust.
Achieving this in Flutter requires:
- controlling rebuild frequency
- isolating repaint regions
- leveraging lazy animation strategies
- monitoring with DevTools
- addressing bottlenecks early
- maintaining clean controller lifecycles
But optimization is not a one-time process. As UI complexity increases, animation performance must be iterated continuously.
Platforms like Digia extend these capabilities by eliminating release friction and enabling instant deployment of animation improvements. This keeps feedback loops tight, experiments fast, and performance regressions short-lived.
Creating fluid, consistent animations becomes not just possible, but operationally sustainable.