
TL;DR: Most apps personalize by segment. A fintech user gets the "investor" layout. A new user gets the onboarding banner. An inactive user gets a re-engagement push. That is not personalization. That is routing. Real personalization happens at the component level, where the same carousel, banner, or CTA renders different content based on what a specific user did in the last session, not which bucket they were assigned to two weeks ago. This article covers the structural difference between static segment-based personalization and dynamic behavior-based rendering, the four behavioral signals that actually predict component performance, what to render when a user has no history (the cold-start problem), and how to run Champion/Evaluator experiments that tell you whether your personalization is working or just adding architectural complexity. Each section includes the metrics to track and the failure modes to avoid.
Why Segment-Based Personalization Has a Ceiling
Segment-based personalization starts with a clean idea: group users by shared traits, then show each group content that fits. Inactive users see a re-engagement banner. High-spenders see premium offers. New users get tutorials. The logic is sound, the implementation is manageable, and the results are real, up to a point.
The ceiling appears because segments are defined at a moment in time and then applied indefinitely. A user who opened the app once and never returned gets assigned to the "low-engagement" segment. Three weeks later, that same user opens the app again, having just received a paycheck. They are now in a high-purchase-intent state, but the segment label has not moved. They still see the re-engagement banner designed for someone who has drifted away, not the high-conversion offer designed for someone ready to transact.
Traditional A/B testing, the closest cousin to segment-based personalization, produces a 3 to 5 percent conversion lift and wins statistically only 25 percent of the time across experiments. Behavior-based personalization, where content decisions derive from what a user is doing right now rather than which historical cohort they belong to, produces conversion lifts of 30 to 50 percent at comparable win rates. The difference is not the technology. It is the latency of the signal. Segments look backward. Behavioral triggers look at the current session.
McKinsey's personalization research, cited consistently through 2025, puts the revenue lift from effective personalization at 5 to 15 percent, with a 10 to 30 percent improvement in marketing spend efficiency. The study also found that companies with faster growth rates derive 40 percent more of their revenue from personalization than slower-growing competitors. The gap between those figures and what most apps actually achieve comes down to one thing: they are personalizing at the segment level when they need to be personalizing at the component level.
The specific failure mode is static content in a dynamic rendering context. An app uses server-driven UI so the server controls what the client displays. The infrastructure is there for real-time component-level decisions. But the team configures it with segment-based rules written once per quarter. The SDUI architecture gets used to deploy faster, not to personalize deeper. The result is a sophisticated plumbing system delivering the same stale water it always did.
What Dynamic UI Rendering Actually Means
Dynamic UI rendering is the practice of having the server decide, at request time, what content a specific UI component should display for a specific user. The client app contains the component structure. A product card exists. A banner slot exists. A hero carousel exists. The server fills those slots with content that changes per user and per session, without requiring an app release.
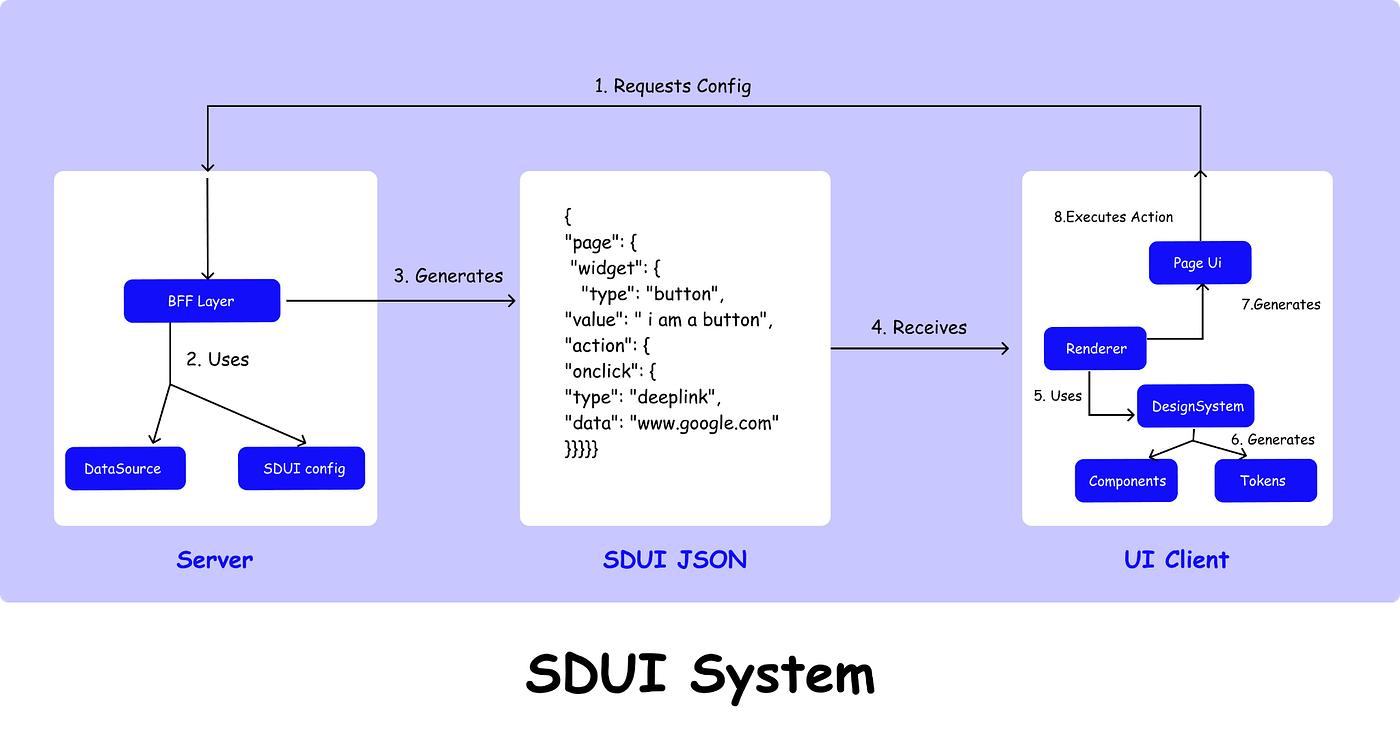
Server-driven UI systems like Zomato's Kimchi engine made this operational at scale: the server defines what the layout shows, the client renders it. Shopify uses the same approach to show different store layouts to different merchants. Meta uses a variation of this for parts of Instagram. The architecture is now table stakes for any app running serious personalization experiments.
The distinction between personalization types that matters here:
Static personalization sets content at the segment or account level once, then applies it until the rules are manually updated. A segment called "power users" sees a dashboard-first layout. Everyone in that segment sees the same layout regardless of what they did in the last session. Configuration is manual. Updates require a deploy or a dashboard edit.
Dynamic personalization sets content at the user and session level, recalculated on each request. The server receives the user ID and recent event history, evaluates which content variant is appropriate for this user at this moment, and returns the component payload. Two users in the same segment can receive entirely different component content if their last-session behavior diverged. No manual rule update required.
The difference in practice is the difference between a billboard that stays up for a month and a conversation that responds to what the other person just said.
Braze's research on dynamic personalization confirms the underlying principle: static personalization customizes once based on broad segments, while dynamic personalization continuously updates as new data comes in. The operational question is not whether dynamic rendering is better. It is what signals to feed the rendering decisions.
The Four Behavioral Signals That Actually Move the Needle
Not all behavioral signals are equal. Apps emit hundreds of events per session. Most of them are noise for personalization purposes. The four signals that consistently predict component performance are last action, feature used, purchase history, and session depth.
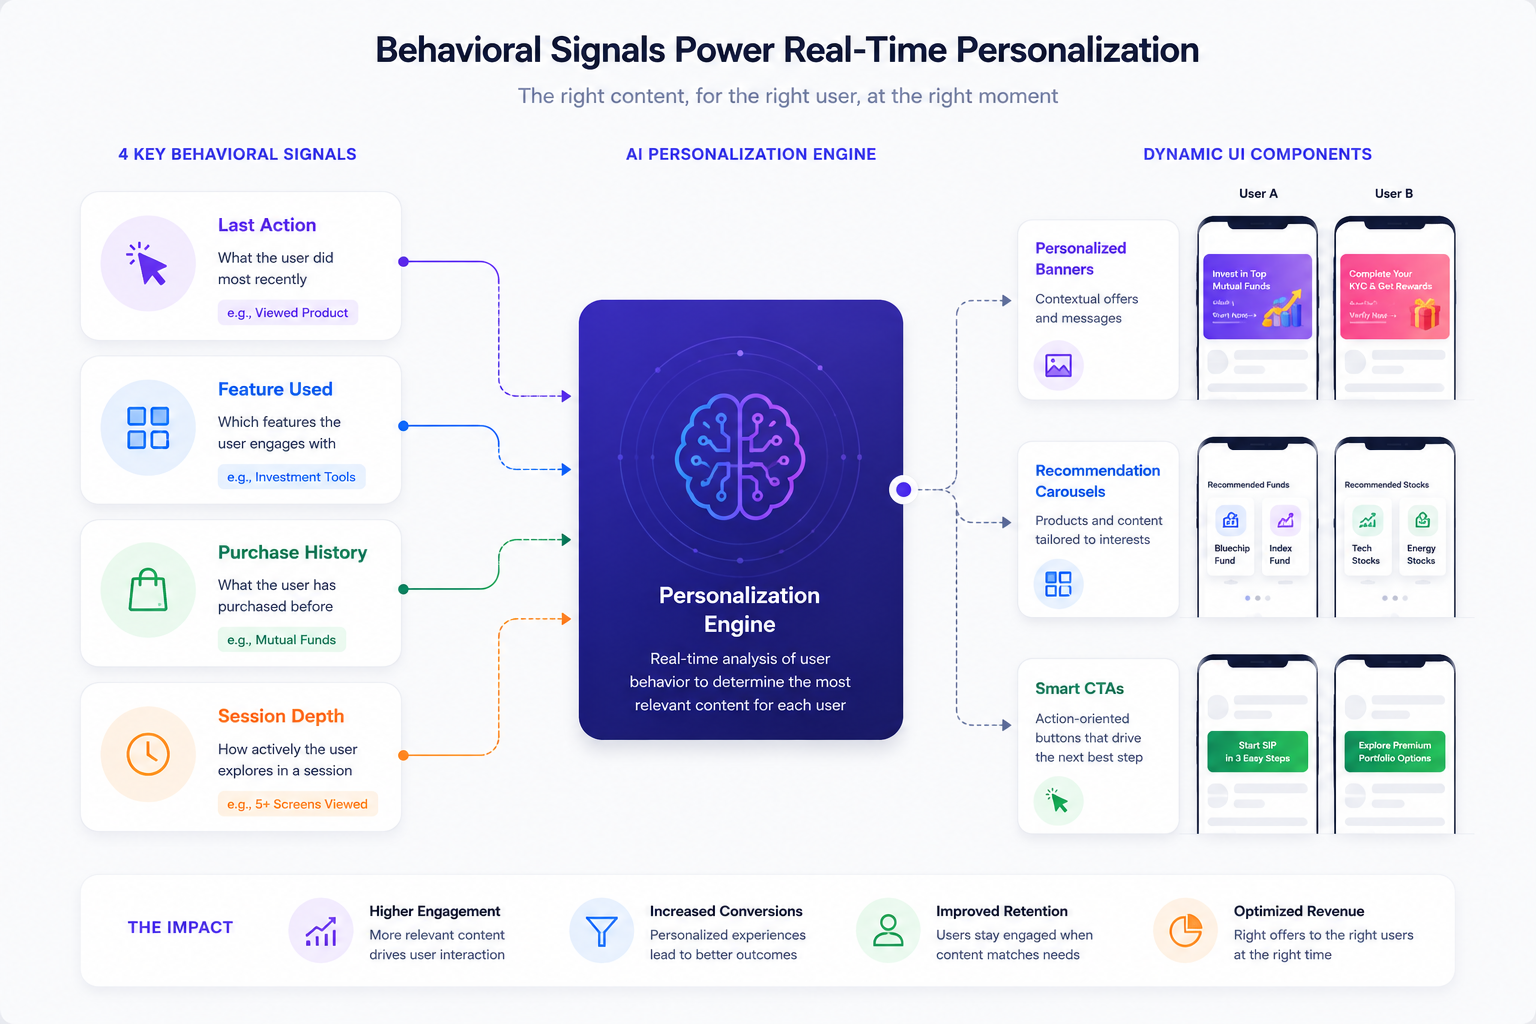
Signal 1: Last Action
The most recent thing a user did inside the app carries more predictive weight than anything in their historical profile. A user who just completed a transaction is in a post-purchase state. The correct component to render is either a confirmation-oriented content block or a cross-sell prompt tied to what they just bought, not a re-engagement banner designed for someone who has been absent.
Last action is the signal with the shortest decay window. Its predictive value drops within the current session and fades to near zero within 24 to 48 hours. This means components informed by last action should fire within the active session, not 72 hours later in a scheduled campaign.
Signal 2: Feature Used
Which features a user has touched tells the rendering engine which content categories are relevant. A user who has activated the analytics dashboard three times in the last two weeks is a candidate for components that surface analytics-adjacent content. A user who has never opened the analytics dashboard is not. Showing them a premium analytics upsell based on segment alone ignores a reliable disqualifying signal sitting in the event log.
Feature-used data also identifies the boundary between engaged and unengaged features. If a user activated a feature once and never returned, the correct component response is a re-engagement nudge tied to that specific feature, not a generic feature discovery prompt for something else.
Signal 3: Purchase History
Purchase history informs not just what to show but how to frame it. A user with a high-order-value history processes price anchors differently than a user whose entire transaction history clusters around low-cost items. A user who has purchased three times in 30 days has a very different economic relationship with the app than a user who made one purchase four months ago.
Dynamic Yield's benchmarks show an 89 percent increase in purchases when content recommendations are driven by behavior-first signals, with purchase history as a primary input. The mechanism is not magic. It is relevance: a user who bought running shoes and then searched for GPS watches is a high-probability candidate for a smartwatch upsell. Showing them a generic "trending products" grid misses a signal that is already in the data.
Signal 4: Session Depth
Session depth measures how far into the app experience a user is within a given session, tracked by the number of screens visited, the time elapsed, and the actions taken before the current screen renders. Session depth is a real-time intent signal. A user who is on screen 7 of a session and has already completed two actions is in an active engagement state. A user who landed on the home screen and has not yet taken any action is in an orientation state.
The same component should render differently for these two users even if they share the same demographic profile and historical segment. The deep-session user is ready for a higher-commitment prompt. The shallow-session user needs orientation content before any conversion attempt.
Session-based personalization systems can infer intent from as few as three to five in-session interactions, which means components can start making informed rendering decisions within the first 60 to 90 seconds of an active session without waiting for the user to produce a rich behavioral history.
How the Same Component Shows Different Content to Different Users
The technical implementation of component-level personalization rests on one architectural decision: the server, not the client, controls the content payload for each component slot.
A product card component in the app has a defined structure: an image field, a headline field, a sub-headline field, and a CTA field. The component structure never changes. What changes is what the server puts into those fields for each user request. Two users load the same home screen. The server returns a different payload for each of them. User A, who browsed fitness products last session, sees a fitness-product card. User B, who browsed electronics, sees an electronics card. The component is identical. The content is different. Zero app releases required.
This model generalizes across component types:
Banner slots render different copy, images, and CTAs based on which behavioral signals are active. A banner promoting a subscription upsell shows the delivery-fee-specific savings calculation for a user who just added to cart, and hides entirely for a user who has been inactive for three weeks and is not in a conversion-ready state.
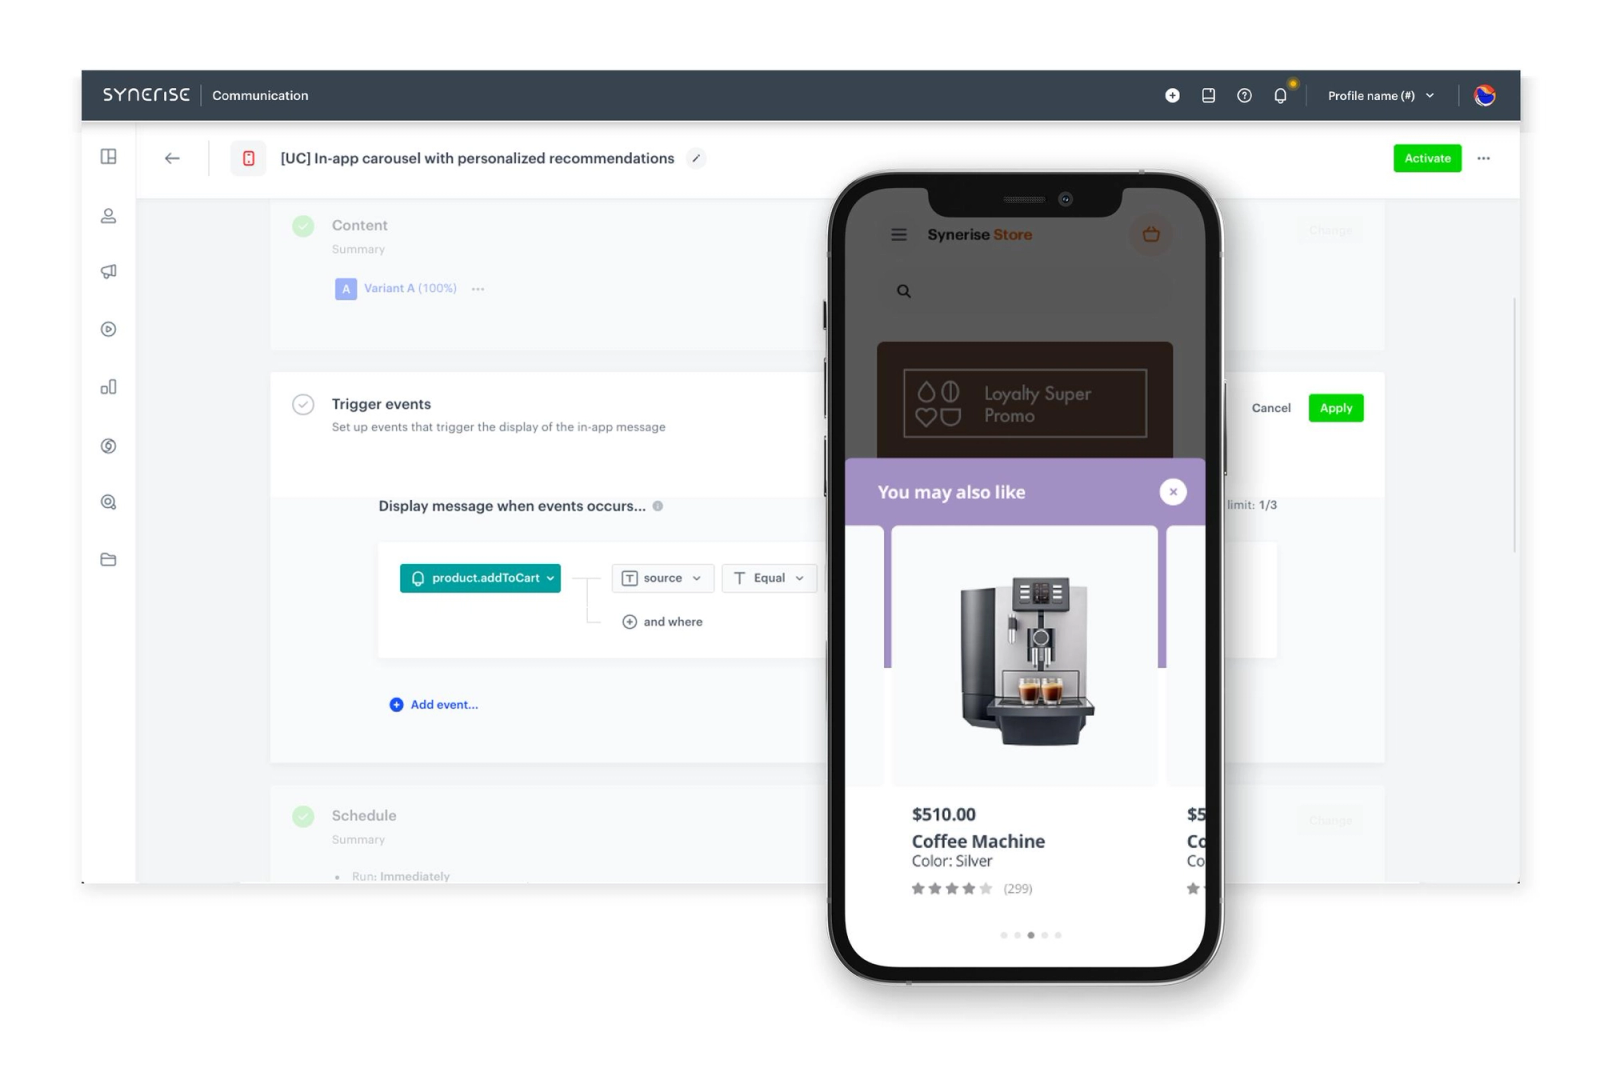
Recommendation carousels surface different item sets per user based on the intersection of purchase history, browse history, and category affinity. The carousel component renders in the same position on every user's home screen. The items inside it are calculated per user at request time.
Navigation states change the prominence of certain app sections based on which features a user has activated. A user who uses the analytics section frequently sees a primary navigation entry for it. A user who has never visited analytics does not need that entry elevated, and the navigation component renders with a different configuration for them.
HubSpot's study of 330,000 CTAs found that personalized calls-to-action convert 202 percent better than generic default CTAs. The mechanism is the same whether the CTA is on a website or inside a mobile component: the content that aligns with what a specific user is doing in their current session converts dramatically better than the content that was written for an average user who does not exist.
The operational requirement for this model is a rendering layer that can receive a user ID plus a recent event payload, execute a content decision in under 200 milliseconds, and return a component payload formatted for the client to render. Real-time personalization engines that operate within a 200-millisecond window at the decisioning layer produce measurably better results than batch personalization systems that precompute content overnight and serve it stale the next day. Real-time systems deliver 20 percent higher conversion rates compared to batch processing approaches.
The Cold-Start Problem: What to Render When You Have No Signal
Every new user arrives with no behavioral history. The personalization system has no last action, no feature-used data, no purchase history, and no session depth pattern. This is the cold-start problem, and it has a specific set of wrong answers and right answers.
The wrong answer: generic content with no structure. Rendering a generic high-traffic or trending content list as the default is a defensible fallback but not a cold-start strategy. It produces average results because it optimizes for an average user who does not exist. It also creates a flat baseline that makes it harder to detect when behavioral signals start improving component performance.
Wrong answer two: premature personalization. Systems that attempt to personalize before accumulating enough signal consistently underperform those that manage the warm-up phase explicitly. Research on Bayesian warm-up models found a 14 percent accuracy improvement and 12 percent diversity improvement in systems that treated the transition from cold to personalized as its own design problem, versus systems that treated it as a binary switch.
The right approach for cold-start rendering operates in three tiers:
Tier 1: Contextual signals. Even without behavioral history, the server knows things about a new user from the session context: device type, referral source, geographic location, time of day, and the onboarding path they took to get to the current screen. These contextual features can be fed directly into rendering decisions to infer early content preferences before the user has produced any in-app clicks. A user who arrived via a fintech partner referral link is a different rendering candidate than a user who arrived via an organic app store search, even though both have zero behavioral history.
Tier 2: Cluster defaults. Before any individual behavioral profile exists, a new user can be routed to the nearest user cluster based on early session signals and served that cluster's content defaults rather than the global average. Cluster-based initialization for cold-start users dramatically reduces exploration cost compared to serving a global prior. As the user produces interactions, the rendering weight shifts from cluster default to individual signal on a continuous scale, not a binary flip.
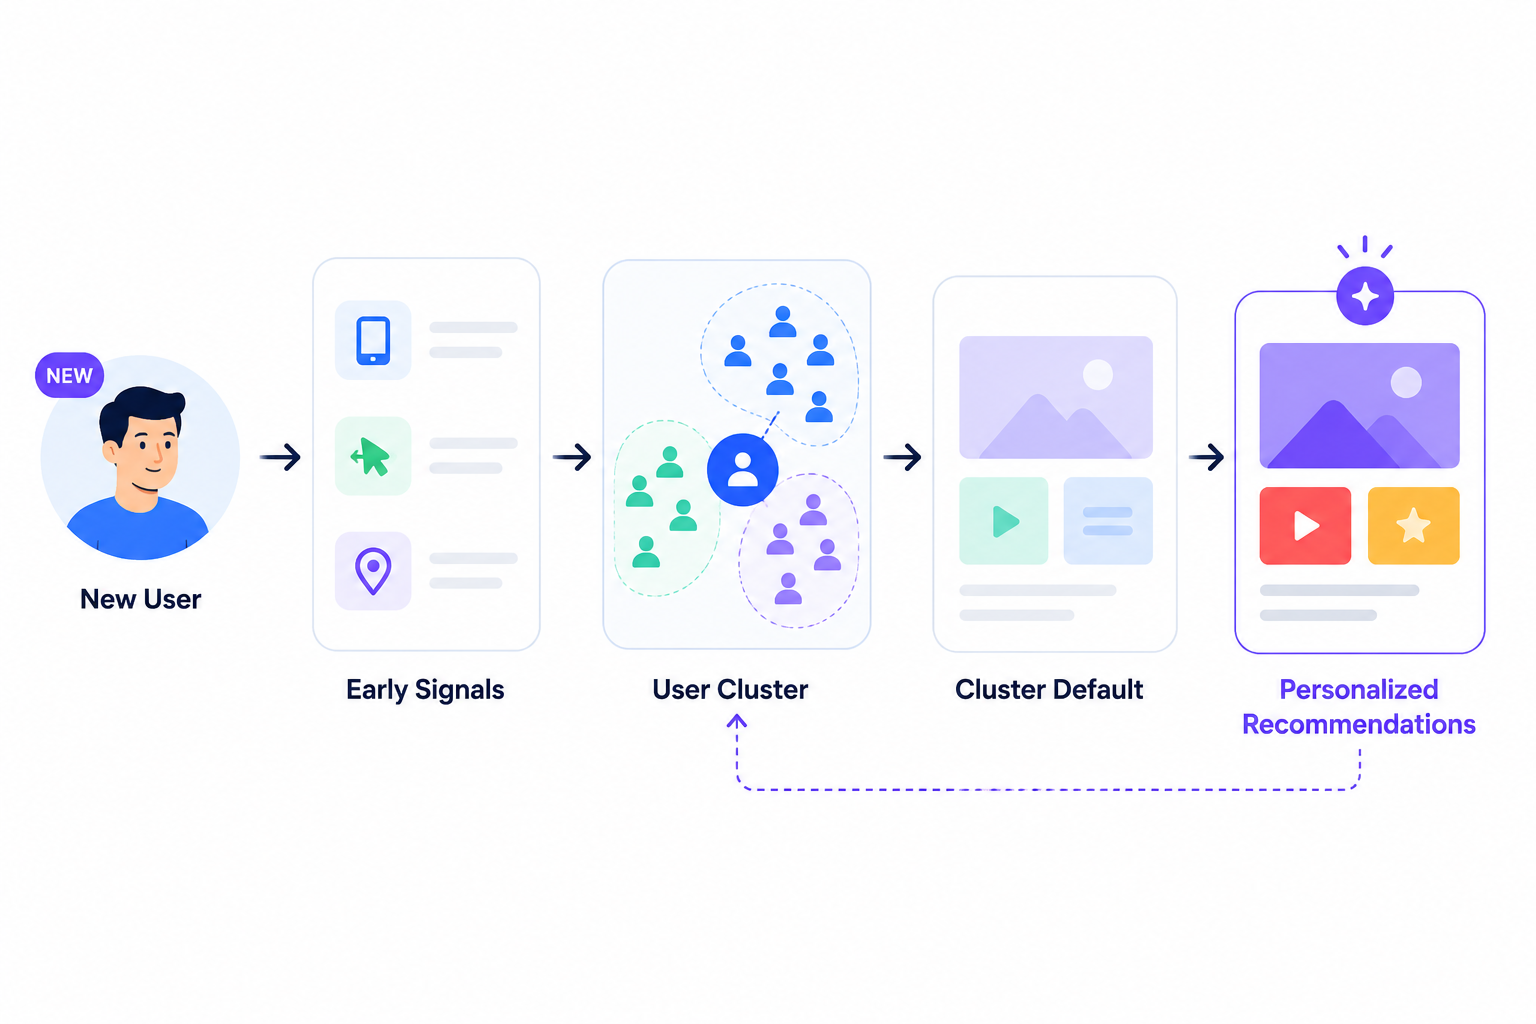
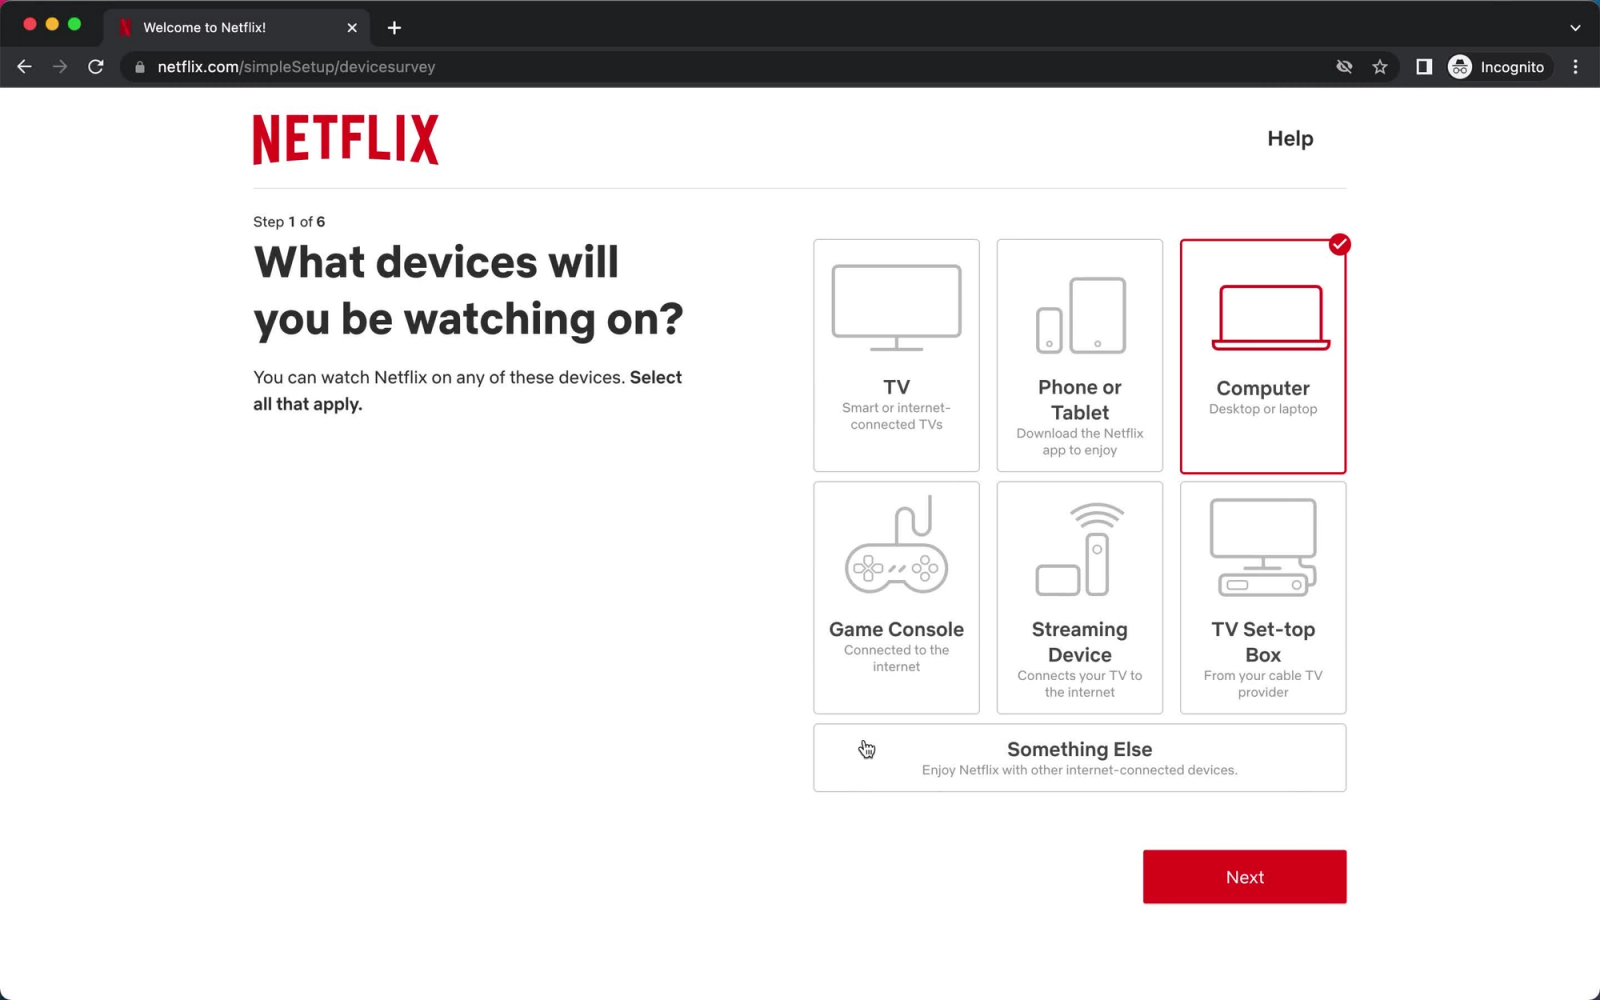
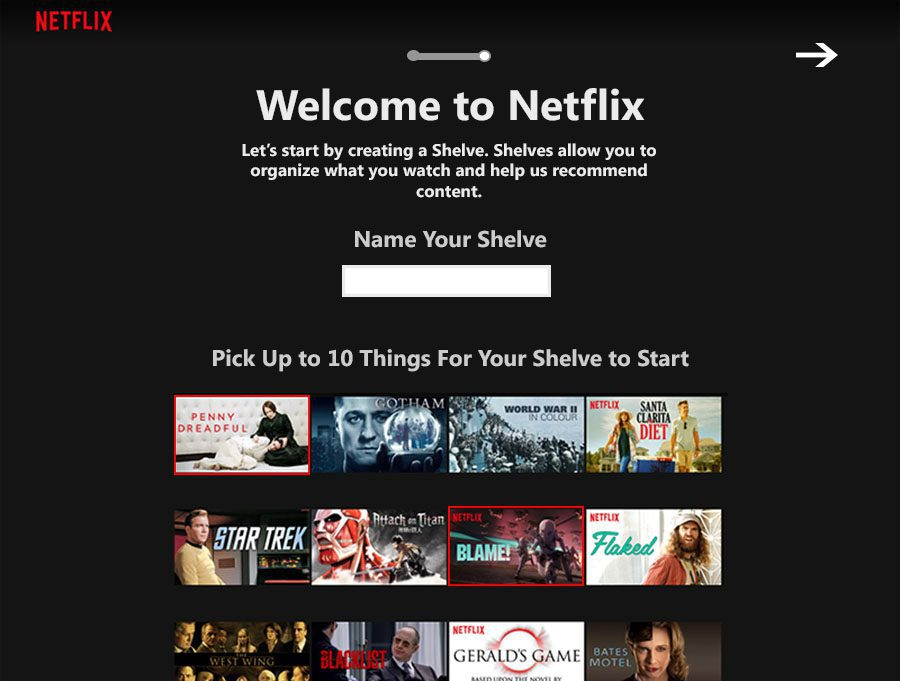
Tier 3: Active elicitation. Netflix's onboarding preference survey is the canonical example: ask a few targeted questions early, use the answers to inform content decisions immediately, and stop relying on pure inference. Combining a short elicitation step with population-level priors reaches 77 to 87 percent of oracle personalization performance while requiring 3 to 5 times fewer interactions than reinforcement learning approaches. In a mobile app context, a two-question onboarding prompt, answered with taps, can collapse the cold-start window from two weeks to two minutes.
The cold-start problem is also a measurement problem. Many teams declare personalization "not working" during the period when the system is still collecting signal, then attribute the poor results to the rendering system rather than to the cold-start baseline. The correct measurement window starts after the system has accumulated enough signal to exit the cold-start tier, not from day one of deployment.
Running Personalization Experiments: The Champion/Evaluator Framework
Personalization experiments fail more often than product teams admit, not because personalization does not work, but because the experiments are structured to answer the wrong question. The typical setup: launch a personalized variant, run it against a generic control, declare success when the personalized variant wins. The problem with that structure is that it answers "does personalization work?" instead of "which personalization approach works best, and under what conditions?"
The Champion/Evaluator model restructures the experiment to answer the more useful question.
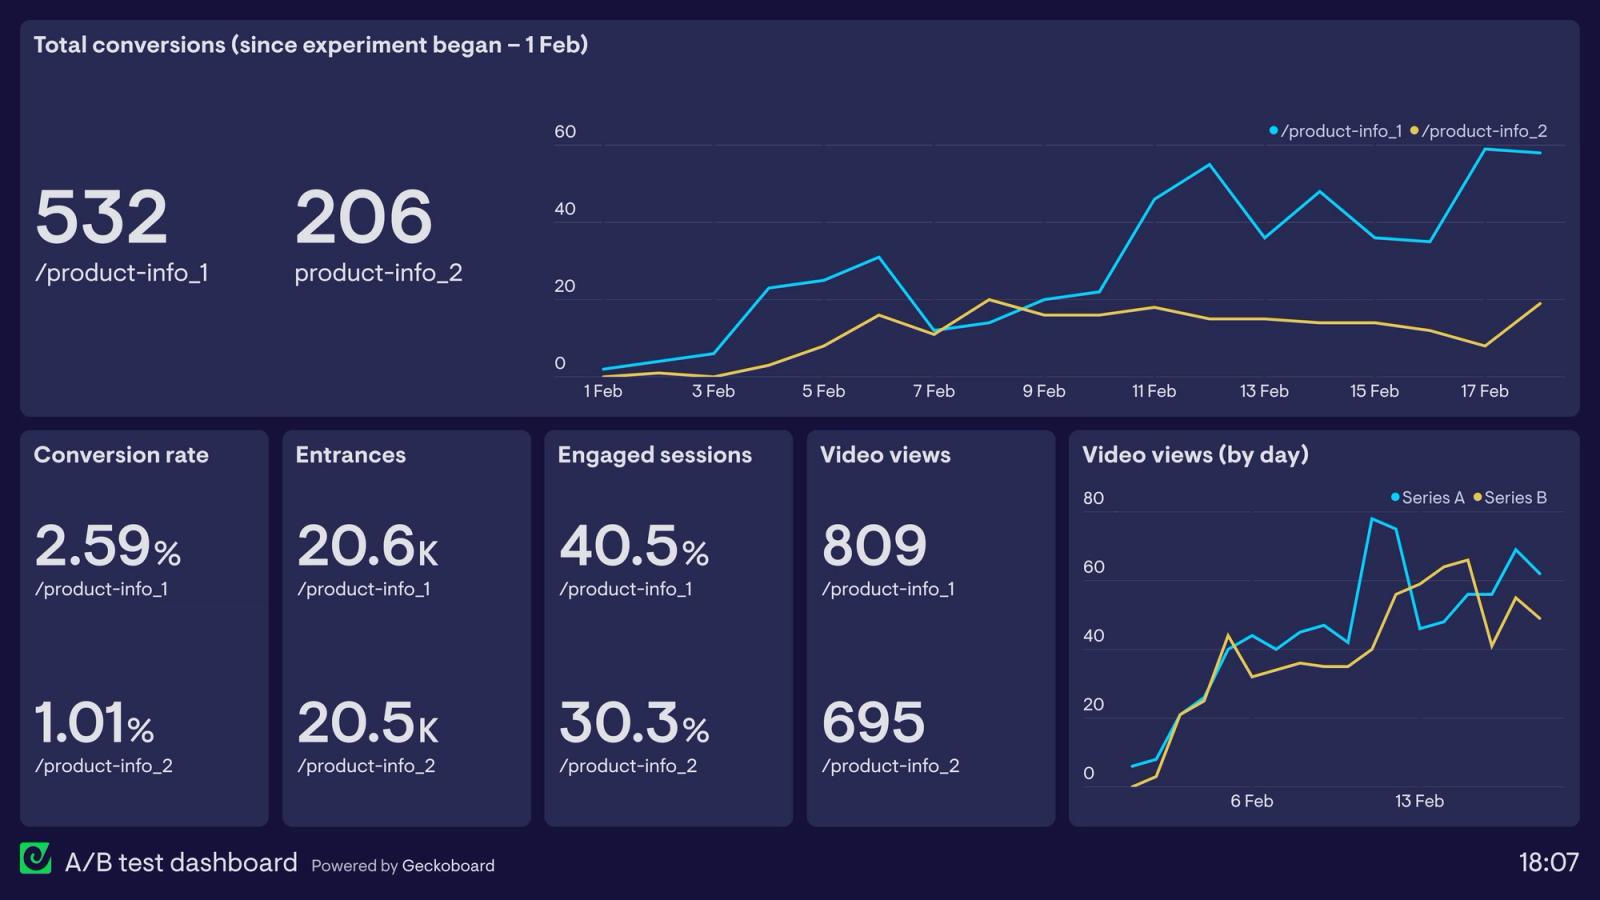
The Champion is the best current performing personalization approach. When no experiments have run, the champion is the generic content baseline. After the first experiment, the champion is whatever variant won. The champion is the live production experience. It serves the majority of traffic.
The Evaluators (challengers in classic champion/challenger terminology) are one or more alternative personalization approaches running simultaneously against the champion on a controlled traffic split. Each evaluator tests a specific hypothesis about a different rendering decision: different signal weighting, different content algorithm, different component priority, different session depth threshold for triggering a behavior-based variant.
The structural advantage of the Champion/Evaluator model over sequential A/B testing is that it runs all alternatives in parallel under the same live conditions, avoiding the bias that comes from testing in different market moments. Champion/Challenger experiments in decision management show that running alternatives simultaneously prevents the inconsistent results that come from sequential testing across different time periods.
How to configure a Champion/Evaluator personalization experiment for a mobile app:
- Define the component being personalized, the behavioral signal informing the content decision, and the outcome metric you are measuring. All three must be specified before the experiment starts. A vague hypothesis ("let's test personalization on the home screen") produces uninterpretable results.
- Set a traffic split that gives the champion enough volume to maintain statistical stability while the evaluators accumulate enough conversions to reach significance. A 70/30 champion/evaluator split is common for first-run experiments. A 50/30/20 split works when testing two evaluators simultaneously.
- Instrument the downstream metrics from the first component interaction, not just the immediate click. A component that produces a high CTR but zero downstream conversions is generating false lift. The correct measurement follows the user from component interaction through to the outcome you actually care about, whether that is a completed transaction, a feature activation, or a return visit.
- Define the winner promotion criteria in advance. An evaluator that outperforms the champion by 5 percent lift in downstream conversion with statistical significance becomes the new champion. The old champion is retired. A new evaluator runs against the promoted champion. This loop is the mechanism that produces compounding personalization improvement over time.
E-commerce applications using the Champion/Challenger model to test behavioral hybrid recommendation approaches showed a 15 percent increase in user engagement and a 5 percent uplift in sales versus the segment-based champion. The uplift came from the challenger that combined collaborative filtering with real-time behavioral signals, replacing a champion that relied exclusively on historical segment data.
The most common structural error in personalization experiments is testing the personalization system as a whole rather than testing specific decisions within it. "Does our ML-based personalization outperform our rule-based personalization" is a question with a yes/no answer that tells you nothing about which signals drive the lift, which components benefit most, or which user cohorts respond differently. Decompose the experiment to the level of a single signal's contribution to a single component's performance. That produces actionable findings.
Measuring Personalization Lift: The Metrics That Actually Matter
Personalization experiments produce misleading results when teams measure the wrong metrics or measure the right metrics at the wrong level of aggregation. Aggregate conversion rate improvement is the most commonly reported metric and the least useful diagnostic.
Four metrics together constitute a complete measurement of whether dynamic UI rendering is producing real personalization lift or just adding system complexity.
Metric 1: Component CTR by behavioral segment.
Click-through rate on a personalized component should be measured separately for users who received content driven by live behavioral signals versus users who received content driven by segment defaults. If the behavioral signal group and the segment default group show the same CTR on the same component, the behavioral signal is not improving the rendering decision. That is diagnostic information about which signals to keep and which to drop.
Recommendation CTR benchmarks for well-configured personalization systems target 4 to 7 percent on recommendation components, with personalized content engagement measured by time on page and interactions with the personalized element. Rates below 2 percent consistently indicate a mismatch between the signal being used and the content being rendered, not a problem with the rendering infrastructure itself.
Metric 2: Downstream conversion rate.
The metric directly downstream from the component interaction, not the immediate click. A component that drives a click but not a purchase is producing engagement theater. The downstream conversion rate tracks how many users who interacted with the personalized component went on to complete the action the component was designed to drive: a transaction, a feature activation, a subscription upgrade, a return visit.
This metric is where the 202 percent lift in personalized CTAs primarily manifests. HubSpot's 330,000-CTA study found that personalized CTAs convert at three times the rate of generic ones, but the conversion being measured was a downstream action (form submit, trial start) not an upstream click. That distinction is critical for interpreting experiment results.
Metric 3: Session depth change.
Average session depth for users who received behavior-driven component content versus users who received segment-based content. A user who receives a component personalized to their current session intent will typically go deeper into the app before exiting, because the content they encountered was relevant to what they were already doing.
Session depth change is also the early signal for personalization experiments before enough downstream conversion data has accumulated. If session depth increases within the first week of a behavioral signal being applied to a component, that is a leading indicator of downstream conversion lift in weeks two and three.
Metric 4: 7-day return rate for personalized component interactions.
The percentage of users who interacted with a dynamically rendered component and returned to the app within 7 days versus users who saw a generic component. Personalization that drives a single session interaction but fails to increase return rate is producing a hollow metric. The return rate captures whether the personalized experience created enough value to change the user's behavior at the session level, not just within the session.
Behavioral segmentation produces 9 times higher repeat purchase rates than generic segment-based approaches, and the 7-day return rate is the mobile app equivalent of that repeat purchase signal: it tracks whether personalization changed how often users return, not just whether they converted in a single session.
What to avoid in personalization measurement:
Impression counts and page-level lift numbers hide which component-level decision is driving (or failing to drive) the result. Teams that segment deeper and connect insights across components run experiments that produce actionable findings, rather than aggregate lift numbers that confirm personalization is "working" without revealing how to make it work better.
The second thing to avoid: reporting personalization success through channels that each claim credit for the same conversion. Push notification opens, in-app component CTRs, and email clicks can all contribute to a single downstream conversion. Without attribution discipline, each channel reports its own lift figure and the sum exceeds total revenue from personalization, which is a fiction. Budget for multi-touch attribution before reporting experiment results, or the numbers will not add up to anything actionable.
Key Takeaways
- Segment-based personalization assigns users to historical cohorts and applies rules at the group level. It produces real lift, typically 3 to 5 percent conversion improvement, but has a structural ceiling because the signal is backward-looking. Dynamic UI rendering addresses the ceiling by personalizing at the component level using signals that reflect what a user is doing right now.
- The four behavioral signals that predict component performance are last action, feature used, purchase history, and session depth. Each has a different decay window and a different appropriate trigger. Last action has the shortest decay (current session). Purchase history has the longest (weeks to months). Session depth is a real-time signal recalculated on every screen load.
- Component-level personalization works by keeping the component structure constant and having the server return a different content payload for each user request. The same carousel, banner, or CTA renders different content per user without any client-side code changes or app releases. This is the direct application of server-driven UI to personalization experiments.
- The cold-start problem has three tiers: contextual signals available from the first session (device, referral, location), cluster defaults derived from the nearest behavioral cohort, and active elicitation through targeted onboarding questions. Combining all three reaches 77 to 87 percent of oracle personalization performance in a fraction of the interactions required by pure machine-learning approaches.
- The Champion/Evaluator framework runs the current best-performing personalization approach as the live champion while simultaneously testing one or more alternative rendering decisions as evaluators on a controlled traffic split. When an evaluator demonstrates statistically significant downstream conversion lift over the champion, it is promoted to champion and a new evaluator runs against it. This iterative loop is what produces compounding personalization improvement.
- Measuring personalization lift correctly requires four metrics: component CTR by behavioral segment, downstream conversion rate from component interaction, session depth change for personalized versus segment-default users, and 7-day return rate. Aggregate conversion rate improvement conceals which component-level decision is responsible for the result and which needs to be fixed.
Further Reading
From Digia Engage
Inline Widgets covers how content blocks can be injected into any screen position inside an app without modifying the app binary, enabling the same component-level dynamic content approach described in this article. Grids, carousels, and story blocks can be configured to receive server-side content payloads per user.
In-App Nudges explains the behavioral event trigger system that fires personalized prompts based on what users are actually doing in their current session, directly mapping to the last-action and session-depth signals covered here.
Feature Adoption Use Case shows how the feature-used signal, combined with dynamic in-app component rendering, drives first-use and re-engagement sequences without calendar-based triggers.
Zomato's Inline Banner Strategy for Upsell Flows is a detailed case study of the same component-level personalization model in production, where checkout banners render different content based on live order context and user purchase history.
Increasing Feature Adoption with Progressive Nudges covers how the same behavioral signal framework applies to nudge sequences, with specific benchmarks for trigger timing, first-use completion, and re-engagement lift.
Book a product demo to see Digia Engage's behavioral event configuration, component-level personalization setup, and experiment tracking built live in the dashboard, without requiring a code change or app release.
External Sources
McKinsey: What is Personalization? provides the primary source data on the 5 to 15 percent revenue lift range, the 10 to 30 percent marketing efficiency improvement, and the finding that faster-growing companies derive 40 percent more revenue from personalization than their slower peers.
HubSpot: Personalized CTAs Convert 202% Better is the landmark 330,000-CTA study showing the conversion gap between context-matched content and generic defaults. The finding applies to any component where content is matched to the user's current state versus their segment label.
Shaped.ai: Mastering Cold-Start Challenges covers contextual signal bootstrapping, cluster-based defaults, and the modular real-time architecture that makes cold-start personalization operationally feasible without large behavioral histories.
TianPan.co: The Cold Start Problem in AI Personalization provides the Bayesian warm-up model research, the Pep framework data (77 to 87 percent of oracle performance with 3 to 5x fewer interactions), and the architectural principle of separating cold-start handling from warm personalization rather than building one system that tries to span both.
Braze: Dynamic Personalization explains the operational distinction between static and dynamic personalization with examples across push, in-app, and web channels, with specific emphasis on continuous signal updating versus one-time segment application.
Mutiny: A/B Testing vs. Personalization quantifies the conversion lift difference between traditional A/B testing (3 to 5 percent) and behavior-based personalization (30 to 50 percent), with a clear explanation of why segment-based approaches underperform and what changes when signals become session-level rather than historical.
DEV Community: A/B Testing Can't Keep Up with AI covers the shift from A/B testing to contextual bandit and reinforcement learning approaches for personalization, with a four-phase framework for moving from coarse validation to continuous learning, directly applicable to the Champion/Evaluator model described here.
Digia Engage is a no-code in-app campaign platform for mobile product and growth teams. It supports behavioral event triggers, server-side component configuration, dynamic content delivery, and experiment tracking, all managed from a single dashboard without requiring app releases. SDK integration takes under 20 minutes. See how behavioral personalization works inside the platform.