
TL;DR: A mobile release pipeline is only as safe as its slowest honest signal. Most teams do not lack gates , they lack gates that tell the truth, placed where the truth is still cheap to act on. This article covers what a mobile CI/CD pipeline looks like end to end, where each gate type belongs, which automated thresholds actually matter, how to measure and reduce lead time without losing confidence, and the anti-patterns that make teams slower without making them safer.
What a mobile release pipeline actually is
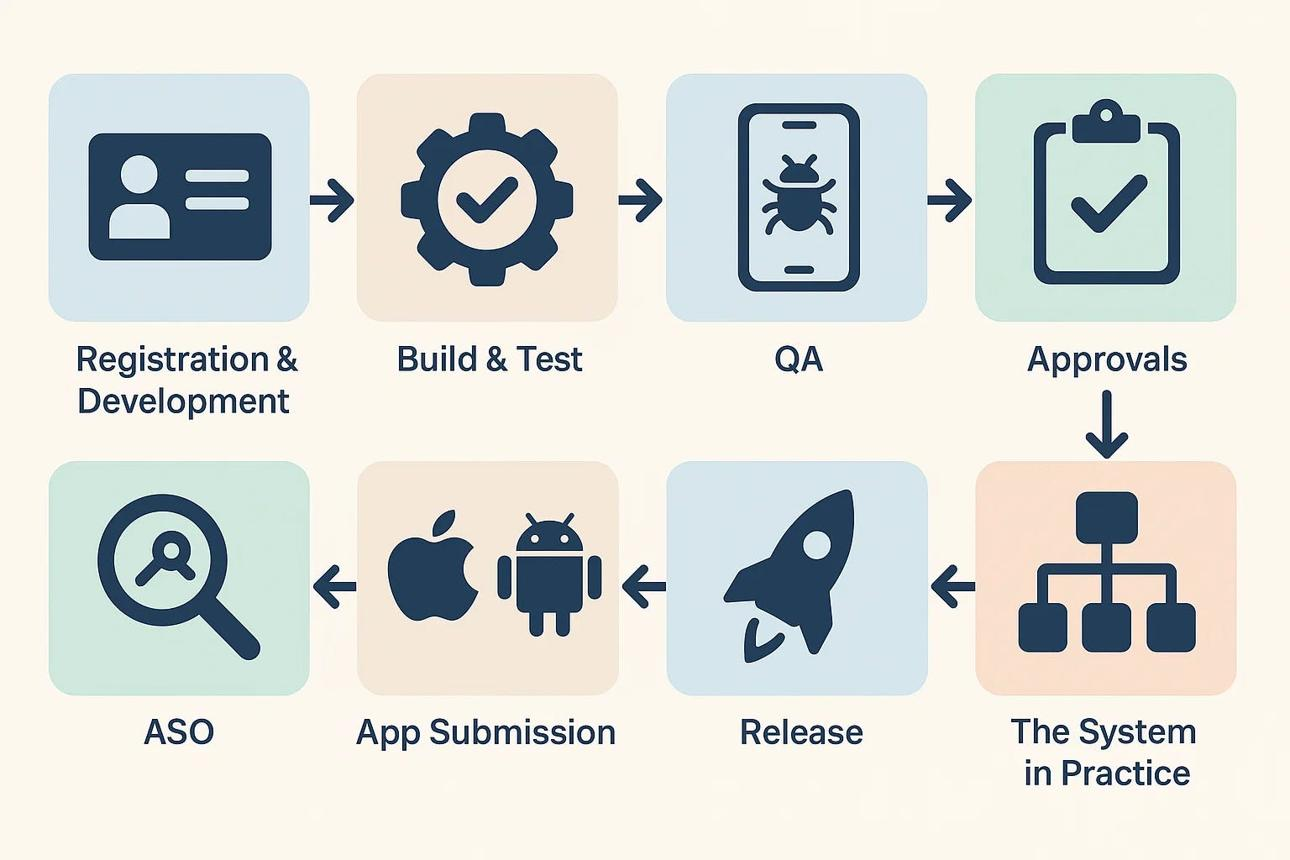
A mobile release pipeline is the automated sequence that takes code from a developer's commit to production users. On web, that journey is measured in minutes. On mobile, it involves platform-specific build toolchains, code signing, real-device testing, store review, and staged rollouts , each of which adds latency, complexity, and failure surface that web pipelines do not encounter.
Mobile CI/CD is structurally harder than web or backend CI/CD. The reasons are concrete. iOS builds require macOS with Xcode , you cannot build them on a Linux runner. Android requires the SDK and Gradle. Code signing on iOS demands a valid distribution certificate and provisioning profile; a misconfigured keystore breaks every Android release build. Testing needs to cover real devices because emulators cannot reproduce OEM-specific rendering issues, manufacturer interrupts, or budget-device memory constraints. And once you submit to an app store, you are waiting for a review process that can take anywhere from two hours to several days.
The pipeline manages all of that. Its job is not to produce a feeling of confidence. It is to produce accurate signal about whether a build is safe to give to users, and to produce it at the earliest point in the process where acting on a failure costs the least.
The cost of catching a bug rises as it moves downstream. A crash caught pre-merge costs a developer an hour of investigation and a PR update. The same crash reaching 5% of production users costs user trust, store ratings, support volume, and potentially a crash rate that triggers Android vitals penalties on the Play Store. Every gate in the pipeline is a bet on where catching a specific class of failure is cheapest.
The four stages and what belongs in each
A well-structured mobile pipeline has four distinct stages. Each has a different cost profile, a different class of failure it should catch, and a different appropriate set of gates.
Stage 1: Pre-merge
Pre-merge is the highest-value real estate in the pipeline. Feedback here blocks a pull request, not a production deploy. The failure is cheap to fix and the developer is still in context on the code. That combination demands fast, unambiguous, non-negotiable gates.
What belongs here:
Lint and static analysis. Tools like SwiftLint, ktlint, ESLint, and TypeScript's compiler catch formatting violations, unused imports, type mismatches, and common coding anti-patterns. These run in seconds and have zero tolerance for failure. A codebase that allows lint violations into main has already decided to let technical debt accumulate without tracking it.
Unit test subset. Run the unit tests covering the modules directly touched by the PR. Running the full unit suite pre-merge is often unnecessary and slows feedback. The goal is catching logic regressions in changed code, not full coverage verification. Full coverage runs post-merge.
Build compile check. The build must compile. A PR that breaks compilation on iOS or Android blocks every other developer on the team from building. This gate should fire in under two minutes and block merge unconditionally.
Target runtime: Under five minutes total. A pre-merge check that takes fifteen minutes will be ignored, disabled, or bypassed. If your pre-merge gate runs longer than five minutes, the bottleneck is almost certainly sequential execution rather than necessary work.
Stage 2: Post-merge
Post-merge gates run against the integrated main branch. The code is already merged. These gates block promotion to staging or the release candidate track. Failures here require a revert commit or a targeted hotfix, both of which cost more than a pre-merge fix but far less than a production incident.
What belongs here:
Full unit and integration test suite. Every test in the suite. The full run establishes the health baseline for the integrated build. Bitrise, GitHub Actions, and Codemagic can run iOS and Android suites in parallel, cutting total runtime significantly.
Smoke tests. Critical-path smoke tests covering the primary user journey: launch, authentication, and the core conversion action. Smoke tests at this stage confirm the build is fundamentally usable before it goes to any testers.
Release build artefact. Build the signed release binary. For iOS, this means building the .ipa with the distribution certificate. For Android, this means building the signed .aab. The artefact produced here is what gets promoted through the rest of the pipeline. Build once, promote the same binary. Do not rebuild for each environment , rebuilding introduces the risk that an environment-specific variable produces a different binary than the one you tested.
Performance baseline comparison. Measure startup time, time to interactive, and memory footprint on a consistent benchmark device. Compare against the previous stable build's baseline. A 200ms increase in cold start time on the benchmark device is a regression worth investigating before release, even if no crash occurred.
Stage 3: Pre-deploy
Pre-deploy gates determine whether the build is ready to reach real production users. This is where you answer the release-specific question: given what changed in this build, is the evidence sufficient to ship?
What belongs here:
Full regression on a real-device matrix. Emulators catch emulator bugs. OEM-specific crashes, GPU rendering issues, and behaviour on budget devices only surface on physical hardware. Services like AWS Device Farm, Firebase Test Lab, and BrowserStack App Automate let you run the full regression suite across your supported device and OS combination matrix without owning the hardware.
Targeted release tests. Tests written specifically for the changes in this build. If the current release includes a redesigned checkout flow, targeted tests cover the new checkout flow paths that regression did not previously include. These are additive, not substitutes for regression.
Automated numeric gates. Define exact thresholds for crash rate, test pass rate, and latency budgets. A build that does not clear all numeric gates does not advance. The thresholds are set before the release, not during it.
Staged rollout configuration. Define the rollout percentage schedule and the monitoring plan before the build ships. A build that reaches this stage without a named person responsible for monitoring it and a documented list of halt thresholds is not ready to deploy, regardless of what the tests say.
Stage 4: Post-deploy
Post-deploy is not testing , it is live monitoring with pre-defined response triggers. The question shifts from "will this break?" to "is it breaking right now?"
What belongs here:
Crash rate monitoring with auto-rollback triggers. Firebase Crashlytics and Sentry both support threshold alerts. Configure an alert that fires if the crash-free session rate drops below your defined floor within any rolling four-hour window. A system that fires an alert and waits for a human to read it is better than nothing. A system that fires an alert and automatically pauses the staged rollout is better still.
ANR and error rate deltas. Application Not Responding events are a secondary stability signal on Android. Track ANR rate as a delta against baseline rather than as an absolute number, because your baseline ANR rate varies with app complexity. Google Play's Android vitals flags apps whose ANR rate exceeds 0.47% of daily active users treat that as a hard ceiling, with your internal threshold set lower.
Latency budgets at p50, p95, p99. Aggregate crash rate tells you the app is broken at a technical level. Latency tells you it is broken at a user experience level. A checkout flow where the p99 API response time doubled is a user-facing regression even if no crash occurred. Track percentiles, not averages. Averages hide what matters in metrics the same way they hide it in analytics.
Version adoption curve. Track the rate at which users update to the new version. An adoption curve that flattens earlier than expected may indicate users actively avoiding the update, which is a signal before reviews arrive.
Automated release gates: the numbers that matter
A gate without a number is an opinion. A gate with a number that nobody calibrated against the app's actual history is a random threshold. Effective automated gates require three things: a specific metric, a specific threshold, and a response that triggers automatically when the threshold is crossed.
These are the four metrics worth wiring up as automated gates:
Crash-free session rate. Top apps reach 99.99% crash-free sessions, while below 99.8% is a red flag. Your internal threshold should be set relative to your app's actual historical baseline, not an aspirational target. If your app historically runs at 98.5% crash-free, setting an automatic halt at 99.5% will fire on every release. Monitor crash-free rates with Crashlytics or Sentry and set alerts for when the rate drops below 99.5%. Calibrate that floor against four to six releases of baseline data before relying on it.
ANR rate (Android). The overall bad behavior threshold for ANR rate per Android vitals is at least 0.47% of daily active users experiencing a user-perceived ANR. Set your internal gate at a lower threshold that gives the team time to respond before the app crosses into store-visibility impact territory. Any gate calibrated exactly at the store's bad-behavior threshold gives you no response window.
Test pass rate. 100% on unit tests is the baseline expectation. For integration tests, you may define a small tolerance for known flaky tests but track flake rate separately. A flaky test that fails 8% of the time does not become acceptable by lowering the pass-rate gate to 92%. It becomes acceptable when it is fixed or quarantined and tracked for remediation.
Latency budget delta. Define the percentage increase in p95 latency for each critical endpoint that constitutes a regression. The specific number depends on your SLAs and user expectations. A fintech app where the investment portfolio loading time increases from 800ms p95 to 1,600ms p95 has a different consequence than a media app where video thumbnail loading increases by the same proportion. Set the threshold to reflect actual user impact, not engineering convenience.
Write all four thresholds in a release runbook before any build ships. The pause decision during a live rollout should be a lookup, not a judgment call made under pressure while a crash rate is climbing.
Smoke tests vs full regression vs targeted release tests
These three test types are not interchangeable. Teams that run the wrong type at the wrong stage pay a tax in either speed, confidence, or both.
Smoke tests answer one question: is the build fundamentally broken? They cover the critical user path launch, login, core action and nothing else. Runtime should be under ten minutes. Smoke tests belong at post-merge, where their job is to prevent a broken build from wasting the time of downstream stages. They are not a substitute for regression and should not be treated as one.
Full regression covers all major user flows across the supported device and OS matrix. It takes longer typically thirty minutes to several hours depending on suite size and device matrix width and it answers a different question: did the changes in this build break anything that was working before? Regression runs pre-deploy. Running it pre-merge on every PR is wasteful in both time and cost. Running it after a build has been promoted past staging is too late.
Targeted release tests are written for the specific changes in a given release. If the current build ships a new home screen redesign, targeted tests cover the interaction patterns that regression does not yet include. They are not part of the permanent test suite until they have been reviewed and promoted to regression. They run alongside regression at the pre-deploy stage.
The sequencing matters as much as the tests themselves. Smoke gates the post-merge build quickly. Regression validates the full system at pre-deploy. Targeted tests validate the specific change. Running smoke and regression in parallel wastes regression time on builds that smoke would have rejected in ten minutes.
One additional test type that belongs in the discussion: performance benchmarks on budget devices. Cold start time and memory footprint on a mid-range device are not covered by functional regression and not revealed by smoke tests. A regression in startup time may be invisible in all functional tests while being very visible to users on older hardware. Benchmark runs on a defined reference device the least-capable device in your supported matrix should be a fixed part of pre-deploy.
Velocity metrics: what to measure and what to ignore
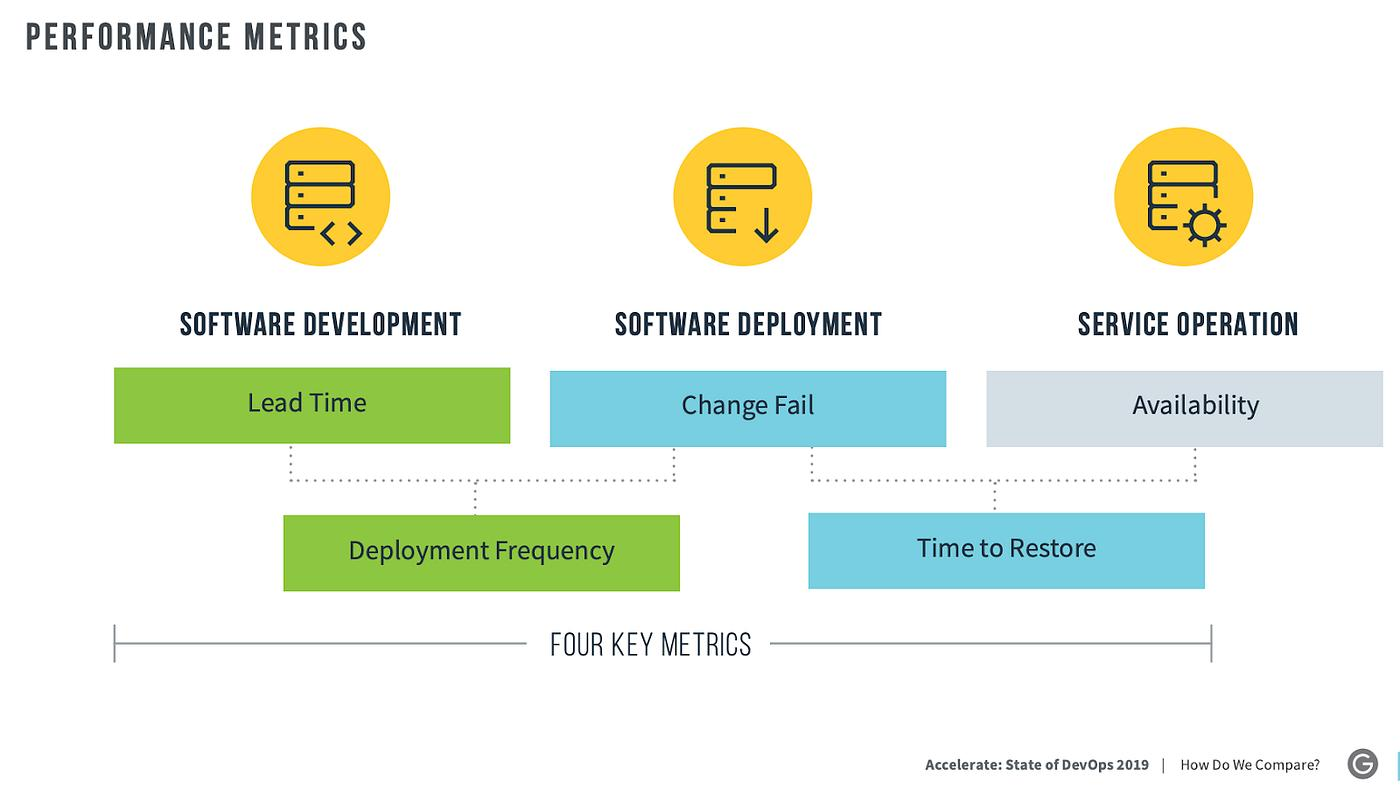
The DORA framework, developed by DevOps Research and Assessment, defines four core delivery metrics that have become the standard for measuring engineering pipeline health. A fifth rework rate was added in 2025.
The 2025 DORA data shows a wide distribution across teams: only 16.2% of organizations achieve on-demand deployment (multiple times per day), with 43.5% of teams requiring more than one week from code commit to production. For mobile teams specifically, the app store review step adds mandatory latency that web teams do not face, which shifts what "elite" performance looks like in practice.
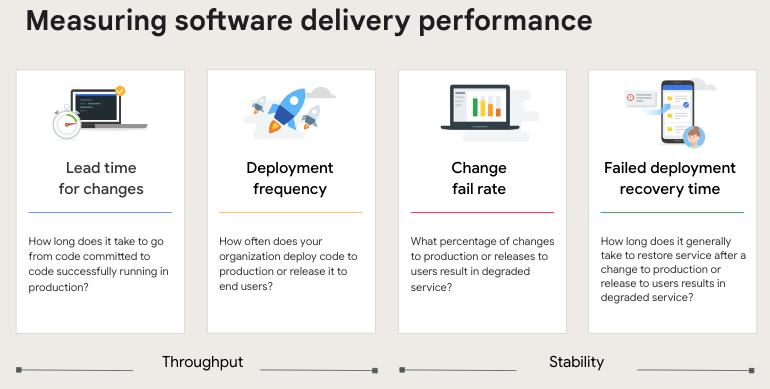
Deployment frequency measures how often code reaches production users. According to DORA research, elite performers deploy 182x more frequently than low performers and have 127x faster lead times for changes. For mobile, deployment frequency is constrained by store review cycles that neither team can fully control but what the team can control is how often builds reach the submission-ready state. Track the frequency at which builds reach the pre-deploy stage as a leading indicator, separate from the frequency at which they clear App Store or Play Store review.
Lead time for changes is the elapsed time from the first commit to a feature or fix to that code running in production. Elite teams achieve lead times under four hours, high-performing teams under 24 hours, while medium performers range from one day to one week. On mobile, lead time includes store review, which means the metric is partly outside the team's control. Separate your internal lead time (commit to submission-ready build) from total lead time (commit to user-visible in production). Improving internal lead time is fully within the team's control. Total lead time includes store review, which means platform-imposed latency should be tracked but not used as a proxy for team performance.
Change failure rate measures the percentage of deployments that cause a production issue requiring immediate remediation a halt to a staged rollout, an emergency hotfix, or a full rollback. Elite performers have an 8x lower change failure rate than low performers. For mobile, track this as the percentage of staged rollouts that were halted or resulted in an emergency hotfix submission within 48 hours of reaching production.
Mean time to recovery (now called failed deployment recovery time in the 2025 DORA framework) measures how long it takes to restore service after a deployment failure. On mobile, this is the elapsed time between identifying a production problem and having a fixed build available to users including the time to build the hotfix, submit it, clear review, and complete the rollout.
Rework rate, the fifth metric added in 2025, tracks the proportion of delivery effort spent correcting problems introduced in previous cycles rather than delivering new value. 2025 DORA data shows that many teams fall in the 8% to 32% rework range, meaning a significant portion of delivery effort is spent on corrections. High rework rate on mobile often points to insufficient pre-deploy testing or miscalibrated automated gates that allowed regressions through.
One metric worth adding to the standard DORA set for mobile specifically: flaky test rate. A test that fails non-deterministically is not a quality signal it is noise with a cost. Tracking the flake rate per test and the aggregate flaky failure rate per pipeline run quantifies how much of your pipeline time is spent on false negatives. A pipeline that triggers ten re-runs per week because of flaky tests before catching a real failure is not providing ten extra confidence checks. It is consuming resources and training engineers to ignore failure signals.
How to reduce lead time without reducing confidence
Lead time compression is one of the most contested topics in mobile engineering because the obvious interventions removing gates, skipping stages, lowering thresholds do reduce time but also reduce signal. The goal is to remove the time that is not adding signal, not the time that is.
Lead time on a typical mobile pipeline is not consumed uniformly across stages. Most of it is concentrated in three specific places.
Queue time. A CI job sitting in a queue is not running tests. It is not catching bugs. It is burning clock. On teams using shared CI runners or under-provisioned cloud capacity, queue time routinely exceeds execution time. The fix is infrastructure, not process: dedicated runners for pre-merge checks, autoscaling cloud capacity for post-merge suites, parallelized job execution across agents. Bitrise reports that remote caching alone reduces Gradle build times by 72% and Xcode times significantly time savings that do not require removing a single gate.
Sequential execution of parallelizable work. Lint, unit tests, and build compilation can run simultaneously. Most teams run them in sequence because that was the default when the pipeline was first configured and nobody changed it. Mapping the dependency graph of your pre-merge checks and parallelizing everything that lacks a hard dependency is often the single highest-ROI pipeline improvement a team can make. Teams regularly report 30% to 50% reductions in pre-merge check runtime purely from parallelization.
Flaky test reruns. Flaky tests erode trust in the pipeline, waste CI minutes, and slow down deployments. Release pipelines require engineers to explain each failure before they can deploy, and the unreliability of flaky tests makes that more challenging. A test that fails one in eight runs is not providing safety it is consuming time and desensitising the team to failure signals. Track flake rate per test. Tests above a defined flake threshold (commonly 2% to 5%) get quarantined from the blocking gate path and routed to a separate flake-tracking job. Fix or delete quarantined tests within a defined SLA , do not let the quarantine list grow indefinitely.
Artefact rebuilding across environments. Building the same app binary twice once for staging, once for production is wasteful and introduces a subtle risk. Environment-specific build variables can produce different binaries. Build once at post-merge, sign for production at pre-deploy, and promote the same artefact through every subsequent environment. Every rebuild is a potential source of variance between what you tested and what you shipped.
Batching changes into large releases. Teams pushing large, complex changes create review bottlenecks and increase deployment risk. A release that bundles twelve feature changes is twelve times more likely to contain a regression than a release with one feature change, and the regression is twelve times harder to attribute. Smaller, more frequent releases reduce individual change risk and reduce the mean time to identify a regression's source when one does occur. The operational commitment is discipline in batching: features should be flagged rather than held, so that the binary can ship when it is ready rather than when the feature set is complete.
Pipeline anti-patterns that slow teams down
These are the failure modes teams adopt with good intentions and retain through inertia. Each one creates the appearance of a safer, more disciplined process while producing the opposite result.
Manual sign-offs as release gates. A human approval sitting in the middle of an automated pipeline is not a safety measure. It is a bottleneck waiting to manifest. Manual approvals were once considered necessary control points. Today, they are often the biggest speed bumps waiting for emails, sign-offs, or test summaries halts momentum, developers lose context, defects multiply, and releases stagnate.
If you cannot write down the exact criteria the approver is evaluating, the gate is not verifying anything specific. If the criteria are specific, they can be automated. If the gate exists for organisational trust reasons "we want a senior engineer to have seen this before it ships" address the trust issue organisationally rather than encoding it as a pipeline bottleneck. A gate that depends on a human being available at the right time is a gate that will fail during off-hours, across time zones, and during holidays.
Gates that nobody checks. A gate that fires and gets routinely overridden is worse than no gate. It desensitises the team, documents a process that is not actually followed, and generates alert fatigue that extends to other signals. Audit your override rate. Any gate with a consistent override rate above 20% is either misconfigured, miscalibrated, or covering something the team has collectively decided not to care about. Delete it or fix it. Both outcomes are better than a gate that trains engineers to dismiss alerts.
Regression suites that accumulate without pruning. A regression suite that takes four hours is not a safety net it is a tax on every release. Tests that have not caught a real bug in twelve consecutive releases are candidates for removal or demotion to a lower-frequency schedule. Test coverage should be evaluated by failure-to-action rate, not raw test count. A large test suite with a low failure-to-action rate is a collection of assertions about a state of the codebase that the codebase has long since moved past.
Crash rate gates that only run on emulators. Emulators reproduce a subset of production crashes. Device-specific memory constraints, hardware-accelerated rendering failures, and OEM-level behaviour that overrides standard Android API behaviour are invisible on emulators. A crash rate gate that does not include at least one tier of real devices provides false assurance. The gate fires clean, the release ships, and the first reports of a real-device-specific crash come from user reviews three days later.
Running the full regression suite pre-merge on every PR. Full regression is expensive. Running it pre-merge on every pull request means every developer waits for a multi-hour test run before their code can merge. The trade-off is not warranted. The appropriate pre-merge gate is a fast unit test subset covering changed modules, not a full regression run. Regression's job is to validate the integrated build at post-merge, not to validate individual changes before they land.
Building separately for staging and production. This pattern is common and carries a non-obvious risk. If the build process uses any environment variable, configuration flag, or dependency version that differs between staging and production, the binary you tested in staging is literally different code from the binary users receive. Build the release binary once at post-merge, validate it through staging, and promote the identical signed artefact to production. Any configuration difference between environments should be handled at runtime (remote config, environment variables injected at startup) rather than at compile time.
Key takeaways
A mobile release pipeline has four distinct stages. Each stage answers a different question at a different cost.
Pre-merge answers: "does this change break anything obvious?" in under five minutes with lint, a unit test subset, and a build compile check.
Post-merge answers: "is the integrated build stable?" with a full test suite, smoke tests, a release artefact build, and a performance baseline comparison.
Pre-deploy answers: "is this build ready for real users?" with real-device regression, targeted release tests, automated numeric gates, and a defined monitoring plan.
Post-deploy answers: "is it working in production right now?" with crash rate monitoring, ANR and error rate deltas, latency budgets, and rollback triggers.
Lead time hides most in queue time, sequential execution of parallelisable work, and flaky test reruns , not in the gates themselves. Address infrastructure and execution before removing safety checks.
The DORA metrics give a credible framework for measuring pipeline health. According to the 2025 DORA report, which surveyed nearly 5,000 technology professionals, only 16.2% of organisations achieve on-demand deployment. For mobile teams, the relevant targets are internal lead time under four hours, staged rollouts used on every production release, and change failure rate tracked per rollout, not per binary submission.
Manual sign-offs, unmonitored rollouts, and accumulating regression suites that nobody prunes are the three patterns most likely to slow a mobile team without providing a genuine safety benefit.
The pipeline's job is to produce honest signal, early. Confidence built on a gate nobody trusts is not confidence.
How Digia Engage connects
The longer a mobile team's release pipeline, the more valuable a tool that decouples in-app experience changes from binary deployments. Digia Engage lets growth and product teams ship in-app nudges, surveys, gamification mechanics, and content updates without opening a new release cycle. That means changes that do not require a new binary , new onboarding flows, content experiments, feature reveals do not add to release volume or to the pipeline's queue.
Teams using Digia Engage report that the ability to iterate on in-app experiences independently of the release cycle means fewer releases that carry both feature work and engagement logic, which in turn means smaller release batches and lower change failure rates. The release pipeline becomes faster because it carries less weight per cycle, not because gates were removed.
See how Digia Engage works or book a demo.
Further reading
From Digia Engage
- Staged Rollouts: How to Release to Everyone Without the Risk of Everyone
- When NOT to Show a Nudge: Avoiding Engagement Fatigue
- Segmentation in Analytics: Why Averages Hide What Matters
External resources
- Google DORA Research Annual State of DevOps Report
- Android Vitals: Crashes Android Developers
- Android Vitals: ANRs Android Developers
- Bitrise Mobile CI/CD Guide
- Fastlane Documentation
Sources
- Mobile CI/CD: How to Build a Pipeline that Actually Works Drizz.dev, May 2026
- What is Mobile CI/CD and Why It Matters Bitrise
- With AI Coding, the Delivery Pipeline is the New Bottleneck Bitrise Blog, March 2026
- Android vitals: Crashes Android Developers
- Android vitals: ANRs Android Developers
- RDEL #115: What Are the 2025 Benchmarks for the Key DORA Metrics? RDEL Substack
- Deployment Frequency Benchmarks: DORA Tiers Scrums.com, March 2026
- Deployment Frequency: The Metric That Reveals How Fast Your Team Really Ships Flagsmith
- Understanding and Improving Lead Time for Changes GetDX
- DORA Metrics Explained: How to Measure Delivery Performance Axify, April 2026
- Mobile App Testing Crash Rates: 2025 Stats and Trends Alphabin
- Mobile CI/CD Blueprint DevelopersVoice, October 2025
- Flaky Tests in Automation Strategies Ranorex, November 2025
- 5 Bottlenecks Slowing Enterprise Product Delivery Kansoft, November 2025
- IT Release Management Best Practices for 2026 Monday.com
- Deployment Pipeline Anti-Patterns ContinuousDelivery.com
- Staged Rollouts: How to Release to Everyone Without the Risk of Everyone Digia Engage, June 2026
