
A feature is shipped after weeks of effort. It solves a clearly defined problem, passes internal reviews, and makes its way into production with confidence. Within hours, dashboards begin to light up. Users are clicking, exploring, and interacting with the feature. On the surface, everything looks like success.
This is where most teams stop asking questions. Early activity is interpreted as validation, and attention is mistaken for value. The feature is marked as successful, and the team moves forward to the next item on the roadmap.
But the real story unfolds over time. Days later, usage begins to fade. Weeks later, the feature is barely touched. It still exists, but no longer matters. This is how most features fail, not through rejection, but through quiet abandonment that rarely triggers concern.
Adoption Is Not the Same as Usage
Feature adoption is often reduced to a simple event. If a user interacts with a feature once, it is counted as adopted. This makes reporting easier, but it distorts reality. A single interaction does not indicate that the feature delivered value or solved a meaningful problem.
True adoption is behavioral, not transactional. It reflects whether a feature becomes part of a user’s natural flow. If a feature is used once and then ignored, it has not been adopted. It has only been explored.
A feature is not successful when it is used. It is successful when it is reused.
This distinction shifts the focus from measuring exposure to understanding continuity. Products are built on repeated actions, not isolated events.
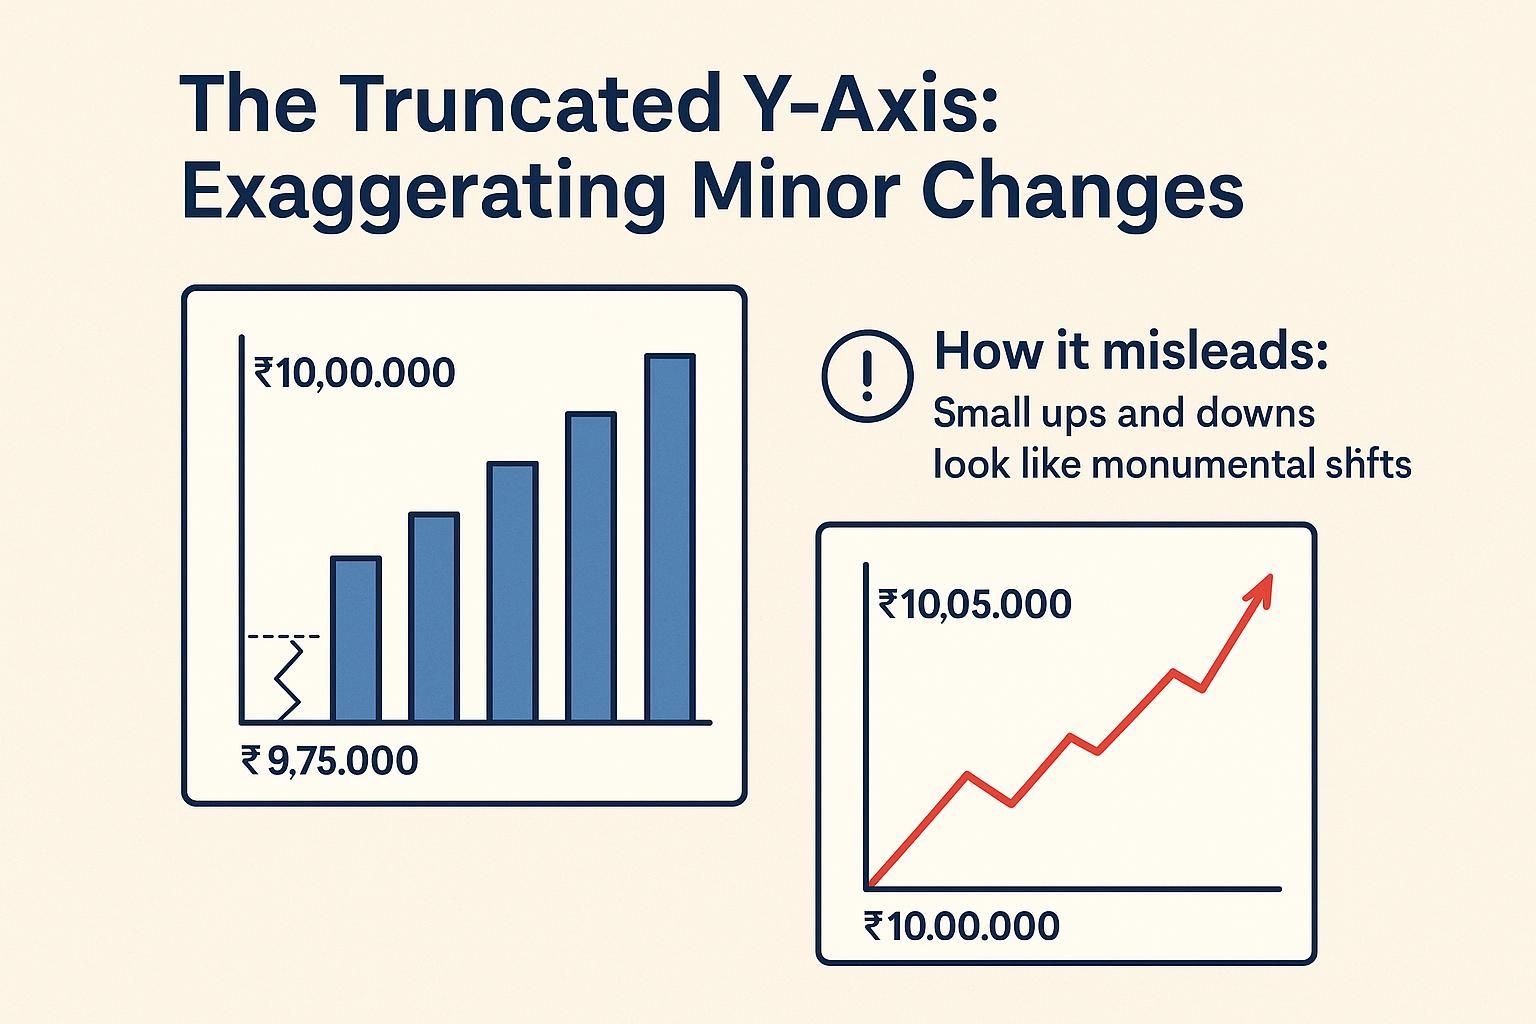
The Spike That Lies: Why Adoption Metrics Mislead
When a feature is released, it almost always produces a temporary spike in activity. This spike is driven by curiosity, visibility, and sometimes even novelty. Users notice something new and interact with it, often without fully understanding its long-term value.
Most analytics systems are designed to capture this moment. They highlight metrics such as first-time usage, click-through rates, and activation percentages. While these metrics are easy to track, they rarely reflect sustained engagement.
| Metric | What It Captures | What It Fails to Capture |
|---|---|---|
| First-time usage | Initial curiosity | Long-term relevance |
| Click-through rate | Visibility effectiveness | Depth of engagement |
| Activation rate | Onboarding success | Habit formation |
The problem is not that these metrics are wrong. It is that they are incomplete. When teams rely on them in isolation, they end up optimizing for discovery rather than value.
The Drop-Off Nobody Investigates
Every feature follows a usage curve. It starts with an initial spike, followed by a gradual decline. This pattern is predictable, yet rarely examined in detail. Most teams focus on the launch phase but ignore what happens afterward.
The decline is not usually sharp enough to raise alarms. Instead, it happens slowly, making it easy to overlook. By the time the feature has effectively lost relevance, it is already buried under newer releases.
What matters is not how many users try a feature, but how many return to it. The absence of repeat usage is the clearest signal of failure, yet it is often the least analyzed metric in feature adoption.
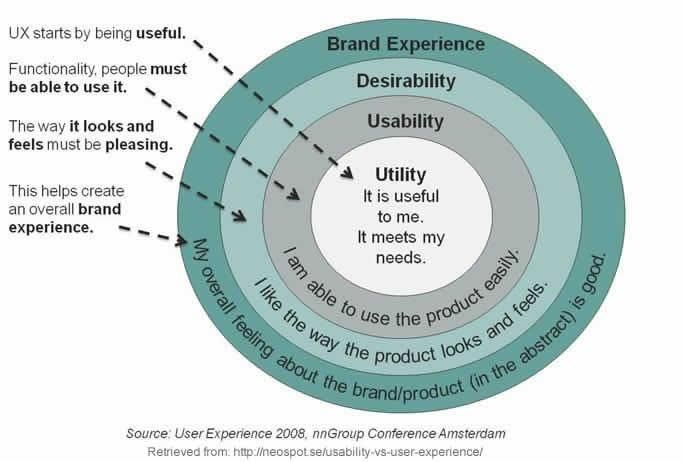
Discoverability vs Usefulness: The Hidden Trade-Off
When a feature underperforms, the immediate assumption is that users are not finding it. This leads to efforts focused on improving discoverability through onboarding flows, prompts, and UI changes. In some cases, this is the right approach.
However, not all adoption problems are discoverability problems. There are two fundamentally different scenarios that need to be separated:
- In one case, users never encounter the feature at all.
- In the other, users try the feature but choose not to return.
These two scenarios require completely different responses. Improving visibility will not fix a feature that lacks usefulness. In fact, it may accelerate negative feedback by exposing more users to something that does not deliver value.
Understanding which problem you are solving is critical before making product decisions.
The Second-Use Test: A Better Definition of Adoption
A more reliable way to evaluate feature adoption is to focus on the second interaction. The first use is often driven by curiosity, but the second use indicates that the feature has delivered enough value to justify returning.
This creates a simple but powerful lens for analysis. Instead of asking whether users tried the feature, the question becomes whether they chose to use it again. This shift eliminates much of the noise created by launch-driven spikes.
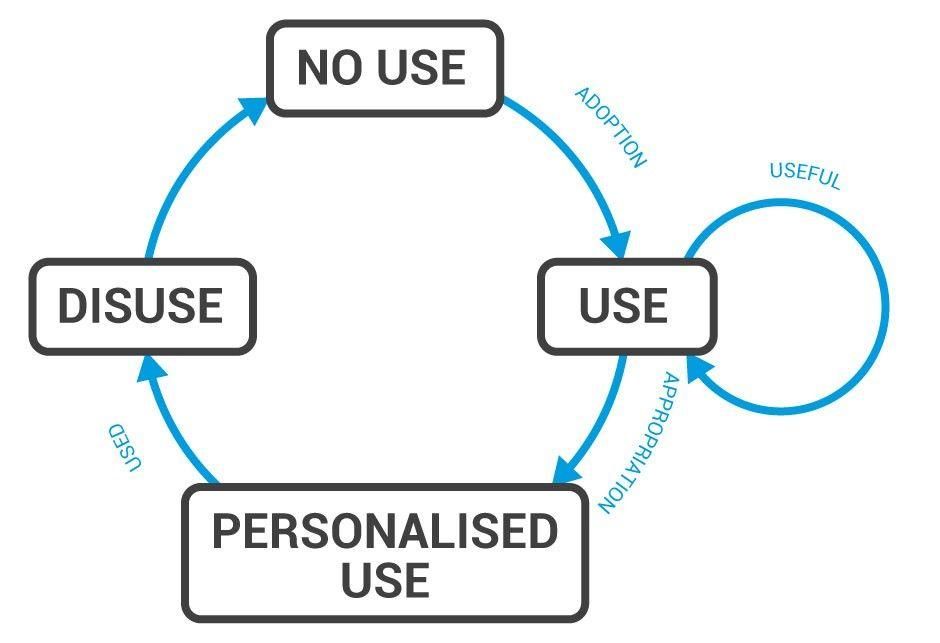
The progression of adoption can be understood as a sequence:
- The first interaction reflects interest.
- The second interaction reflects perceived value.
- Repeated interactions reflect habit formation.
By tracking this progression, teams gain a clearer understanding of whether a feature is truly integrating into user behavior.
Measuring Feature Impact on Retention
Feature-level metrics only tell part of the story. A feature does not exist in isolation. Its purpose is to improve the overall product experience and contribute to long-term retention.
To understand real impact, it is necessary to connect feature usage with user outcomes. This involves analyzing whether users who engage with a feature behave differently over time compared to those who do not.
| Perspective | Focus | Outcome |
|---|---|---|
| Feature Activity | Is the feature being used | Local optimization |
| Feature Impact | Is behavior changing | Product-level growth |
Metrics that indicate meaningful impact include retention rates, session frequency, and churn reduction. If a feature does not influence these outcomes, its contribution to the product is limited, regardless of how often it is used.
The Feature Graveyard Problem
As products evolve, they accumulate features. Each one is built with a purpose, supported by some form of data or hypothesis. However, over time, many of these features lose relevance or fail to gain traction.
They remain in the product, occupying space without delivering value. This creates what can be described as a feature graveyard, a collection of underused or forgotten functionality that continues to exist.
The impact of this accumulation is not just technical. It affects the user experience directly. Interfaces become more complex, decision-making becomes harder, and the clarity of the product diminishes.
A product filled with unused features is not more powerful. It is more confusing.
Why Teams Keep Shipping Features That Don’t Stick
The persistence of failing features is rarely due to poor execution. It is often the result of how teams are structured and how success is defined. Many product organizations are optimized for delivery, with clear incentives tied to shipping new functionality.
In such environments, the act of launching a feature becomes the endpoint, rather than the beginning of evaluation. Feedback loops are weak, and long-term performance is rarely prioritized over short-term output.
This creates a cycle where teams continuously add new features without fully understanding the impact of existing ones. Over time, this leads to increased complexity without corresponding gains in user value.
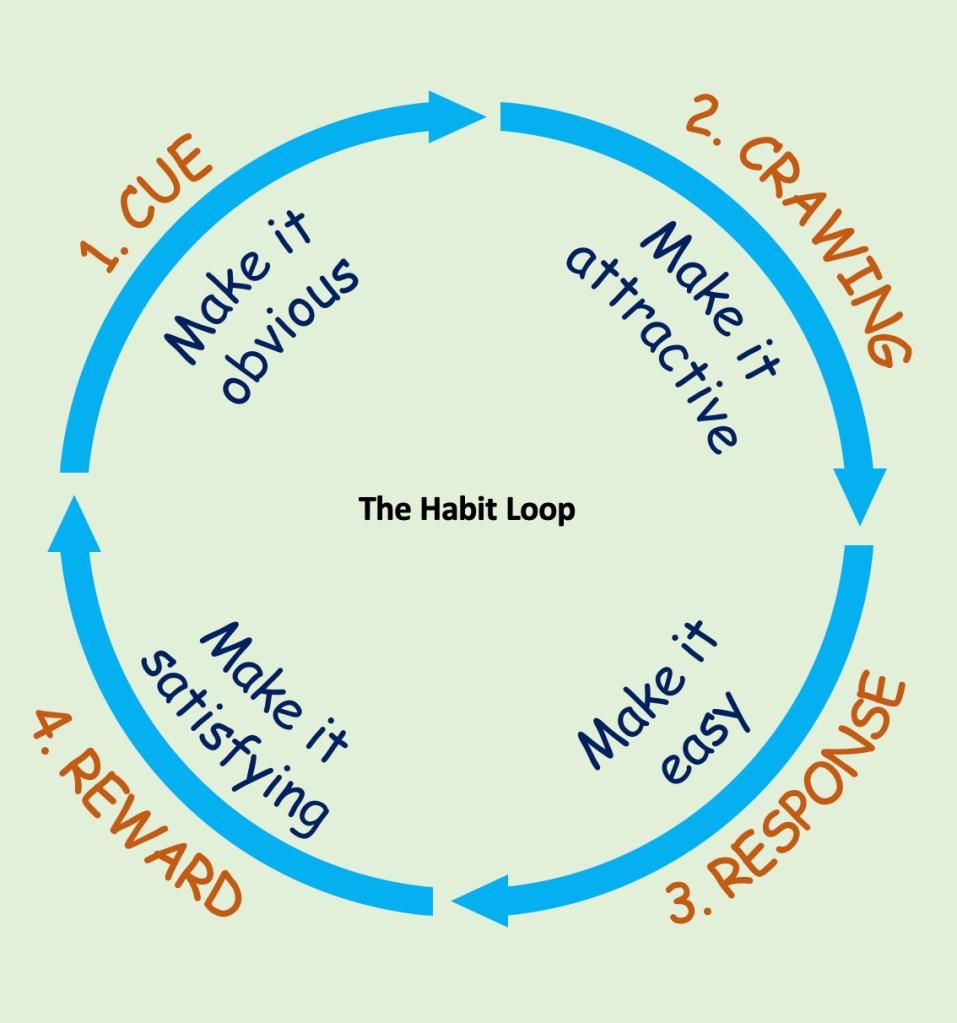
From Shipping Features to Building Behaviors
To address this issue, the focus needs to shift from features to behaviors. Features are simply tools, while behaviors represent how users interact with the product over time. Sustainable growth comes from reinforcing useful behaviors, not from increasing the number of features.
This requires a different approach to product thinking. Instead of starting with solutions, teams need to start with desired outcomes. The question is no longer what should be built, but what should change in user behavior.
When features are designed with behavior in mind, their success becomes easier to evaluate. They are no longer isolated components, but part of a larger system that shapes how the product is used.
A Practical Framework for Evaluating Feature Success
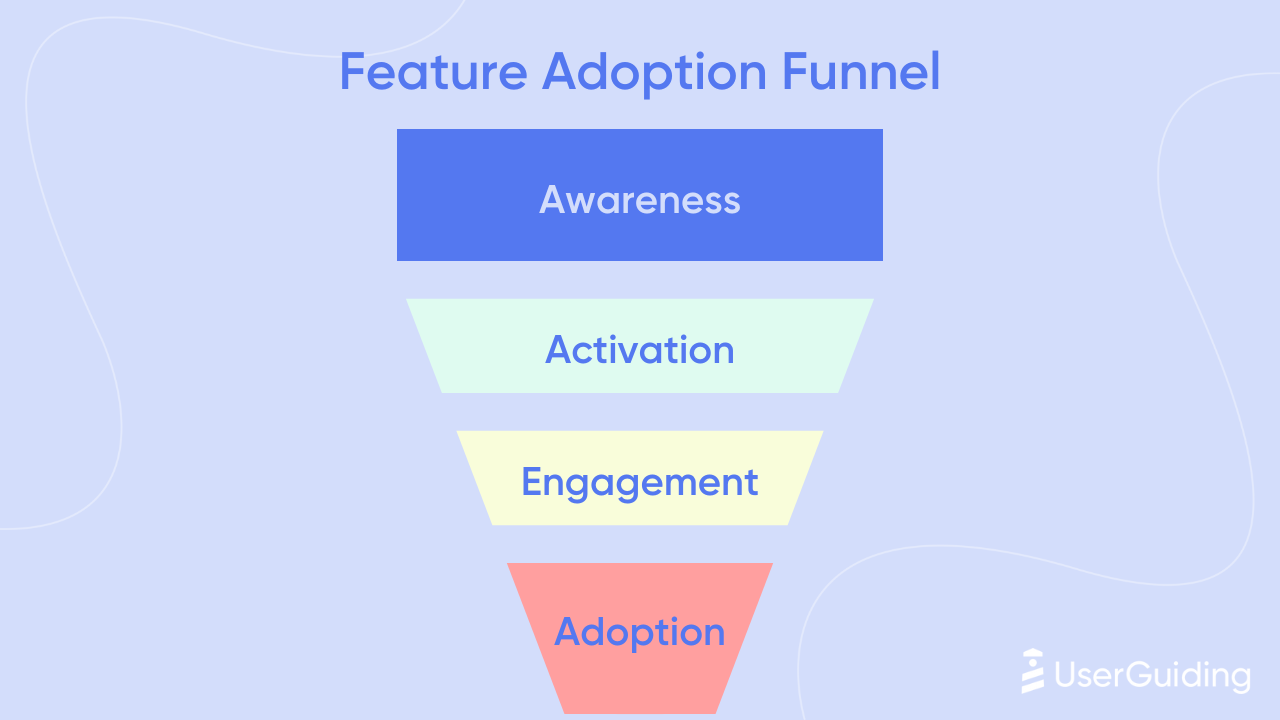
A structured way to evaluate feature adoption is to map the user journey across four stages: discovery, trial, return, and integration. Each stage represents a deeper level of engagement and provides a checkpoint for analysis.
| Stage | Key Question | Metric Example |
|---|---|---|
| Discover | Can users find the feature? | Exposure rate |
| Try | Do users use it at least once? | First-use rate |
| Return | Do users come back to it? | Repeat usage rate |
| Integrate | Does it become habitual? | Retention or frequency lift |
Most features succeed in the early stages but fail to progress further. The goal is not just to drive discovery or trial, but to support the transition toward repeated and integrated usage.
Conclusion: Most Features Don’t Fail Loudly
Feature failure is rarely visible. There are no obvious signals, no immediate breakdowns, and no clear points of failure. Instead, features fade quietly, losing relevance over time while still existing within the product.
This makes feature adoption difficult to measure and even harder to improve. It requires moving beyond surface-level metrics and focusing on long-term behavior. It requires questioning assumptions and rethinking how success is defined.
In most products, the challenge is not that features fail. It is that they fail silently, without drawing attention.
And unless that silence is examined, it continues to shape the product in ways that are easy to miss, but hard to reverse.