




TL;DR
- This report, compiled by Digia Engage, brings together the most current, independently sourced benchmark data available for five specific questions growth teams ask before setting their own targets.
- What click-through rate to expect by in-app format, and how conversion differs by industry vertical when messaging shifts from broadcast to behavioural.
- How much gamification actually lifts engagement over static content.
- How long a no-code deployment realistically takes versus an engineering-dependent one, and how survey response rates differ by trigger type.
- Where genuinely India-specific data exists, it is used and flagged as such. Where the best available data is global rather than India-specific, that is also stated directly rather than presented as a regional number it is not.
- Sourcing note: Every figure in this report is attributed to its original source. No figure is presented as Digia's own proprietary data unless explicitly labelled as such.
Every growth team setting an in-app engagement target faces the same problem: the benchmark they find is rarely built for the specific question they are actually asking. A push notification CTR benchmark says nothing about how a scratch card performs. A global gamification statistic says nothing about whether the lift holds for a fintech app specifically. Digia Engage works with teams across fintech, e-commerce, gaming, and media who are asking exactly these five questions before they set their own targets, which is the reason this report exists: to bring the best currently available, independently sourced answer to each one into a single reference, rather than leaving a team to reconcile five different vendor blog posts on their own.
CTR by Format
Batch's 2025 benchmark study, covering push notifications, in-app messages, web push, and email sent between July 2024 and July 2025, found Android users respond best to pop-up in-app messages at 12.8% CTR, followed by full-screen interstitials at 10% and banners at 8.6%. On iOS, pop-ups led at 11.2%, ahead of banners at 9.6% and interstitials at 4.4%. The same study found promo code campaigns performing strongest of any in-app content type, at 16.1% CTR on Android and 17.9% on iOS, with push re-opt-in prompts also performing well at 11% and 9% respectively.
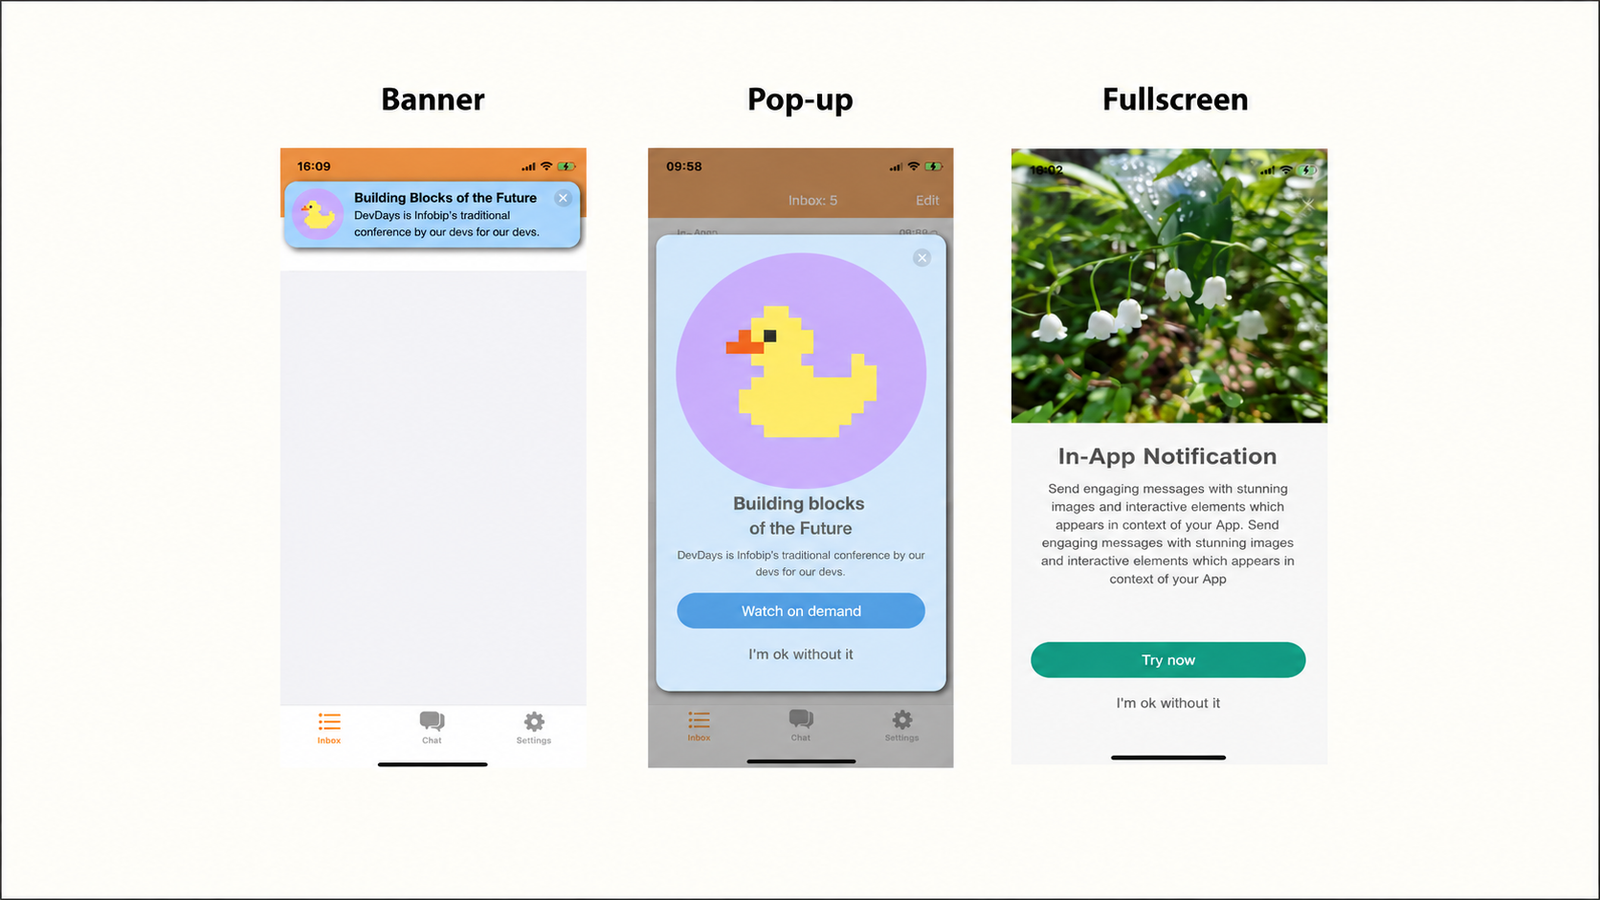
A separate comparison found in-app messaging achieving a 75% open rate against push notifications' 20%, with in-app CTR at 28% against push's 7.4%, a gap consistent in direction with every other source in this category even where the exact magnitude differs. Rich, interactive push formats outperform simple push specifically: VWO Engage measured 9.2% CTR for rich push against 6.9% for simple push, and Airship found interstitial notifications achieving a 35% reaction rate against 18.3% for simple push.
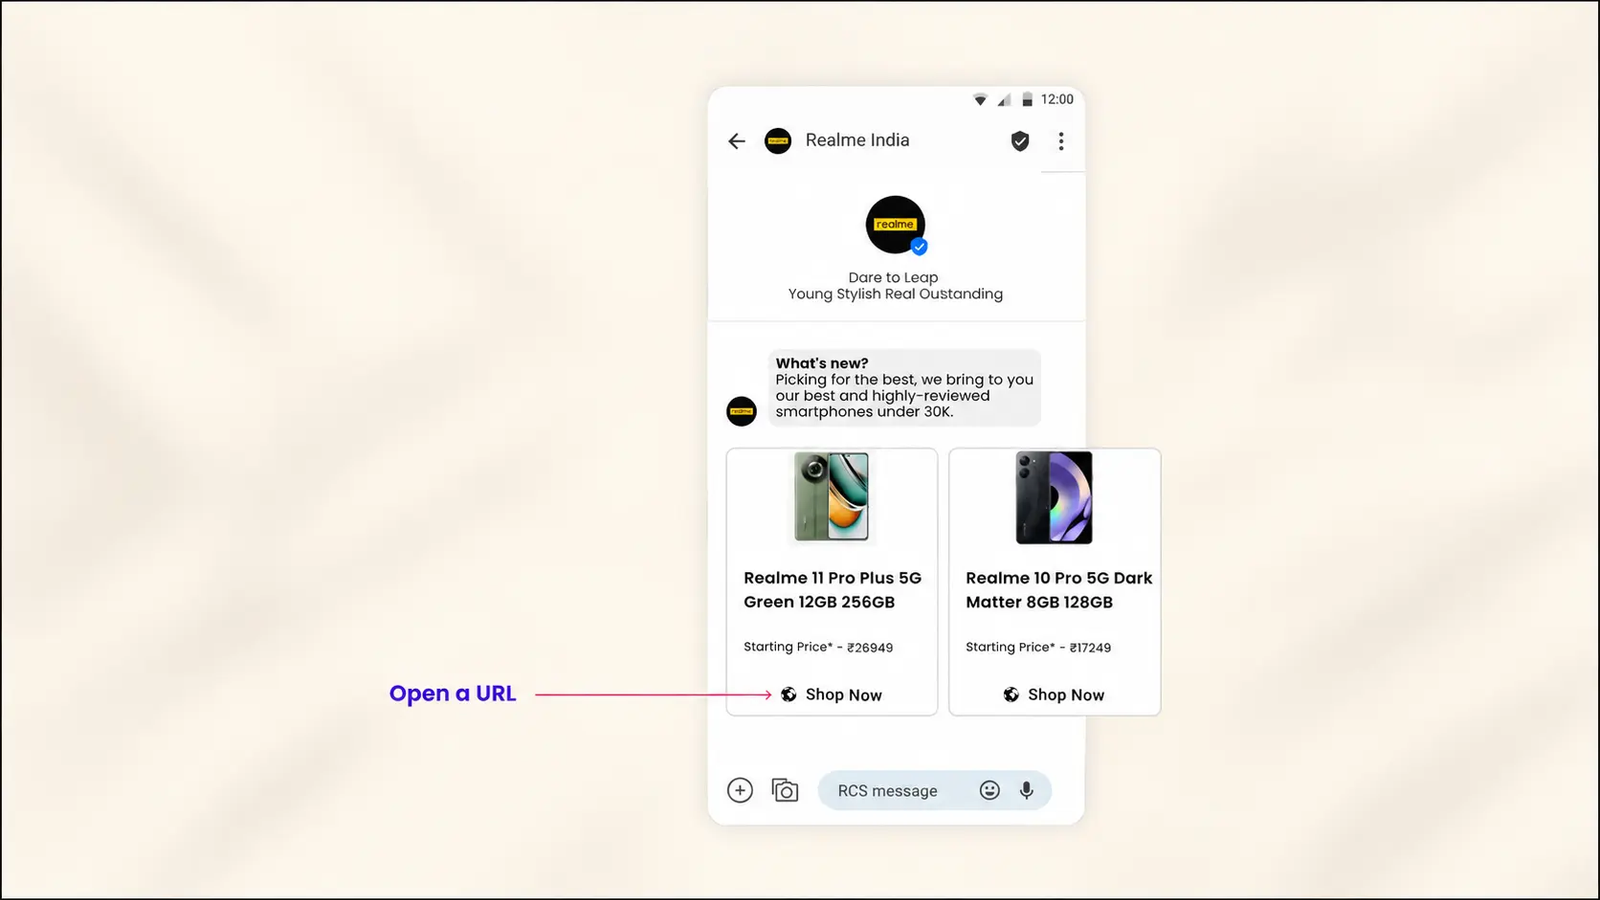
The India-specific data point in this category is stark. RCS messaging in India achieves 85-95% open rates compared to 5-15% for standard push notifications, and a documented Diwali campaign case comparing the two channels on the same 200,000-contact database found RCS generating 20 times more completed orders than push from the identical audience, attributed specifically to notification fatigue from the volume of daily push notifications Indian users receive across news, food delivery, e-commerce, and social apps.
This is directly relevant context for any India-focused team benchmarking in-app against push specifically: the baseline push performance a team is comparing against is measurably weaker in the Indian market than in the global averages most benchmark reports use.
Impression-to-Click by Vertical
MoEngage's 2026 Customer Engagement Benchmark report, analysing 673 billion messages across email, push, in-app, SMS, and on-site messaging globally, found Financial Services unlocking a 16.5x conversion lift when shifting from generic broadcast messaging to utility-driven, behaviour-based messaging across push and in-app channels. Retail and Ecommerce showed the largest reported shift of any vertical in the report: broadcast email open rates collapsing by 60% industry-wide, while brands pivoting to behavioural triggers and in-app messaging captured a 37x conversion multiplier and a 47% in-app conversion rate specifically.
CleverTap's own cross-channel report found fintech apps achieving conversion rates up to 31% when email, push, and in-app messaging worked together, with fintech specifically showing an app-stickiness increase of more than 28% once a brand used more than three engagement channels together. The same report found gaming platforms seeing a 10% conversion increase and 13% engagement lift from combining push, in-app messages, and app inbox, subscription apps seeing a 16% conversion uptick, and ecommerce seeing a 6% conversion increase from a cross-channel strategy incorporating in-app alongside push and email.
The consistent pattern across both independent reports: fintech and financial services show the largest relative lift from behavioural, in-app-inclusive messaging specifically, which is directionally consistent with the trust-and-timing sensitivity documented for financial apps generally, where a well-placed, contextual message matters disproportionately more than in lower-stakes categories.
Gamification vs Static Content
Four independent sources converge on a consistent range for this specific comparison, worth stating together because the consistency itself is the most useful part of the finding.
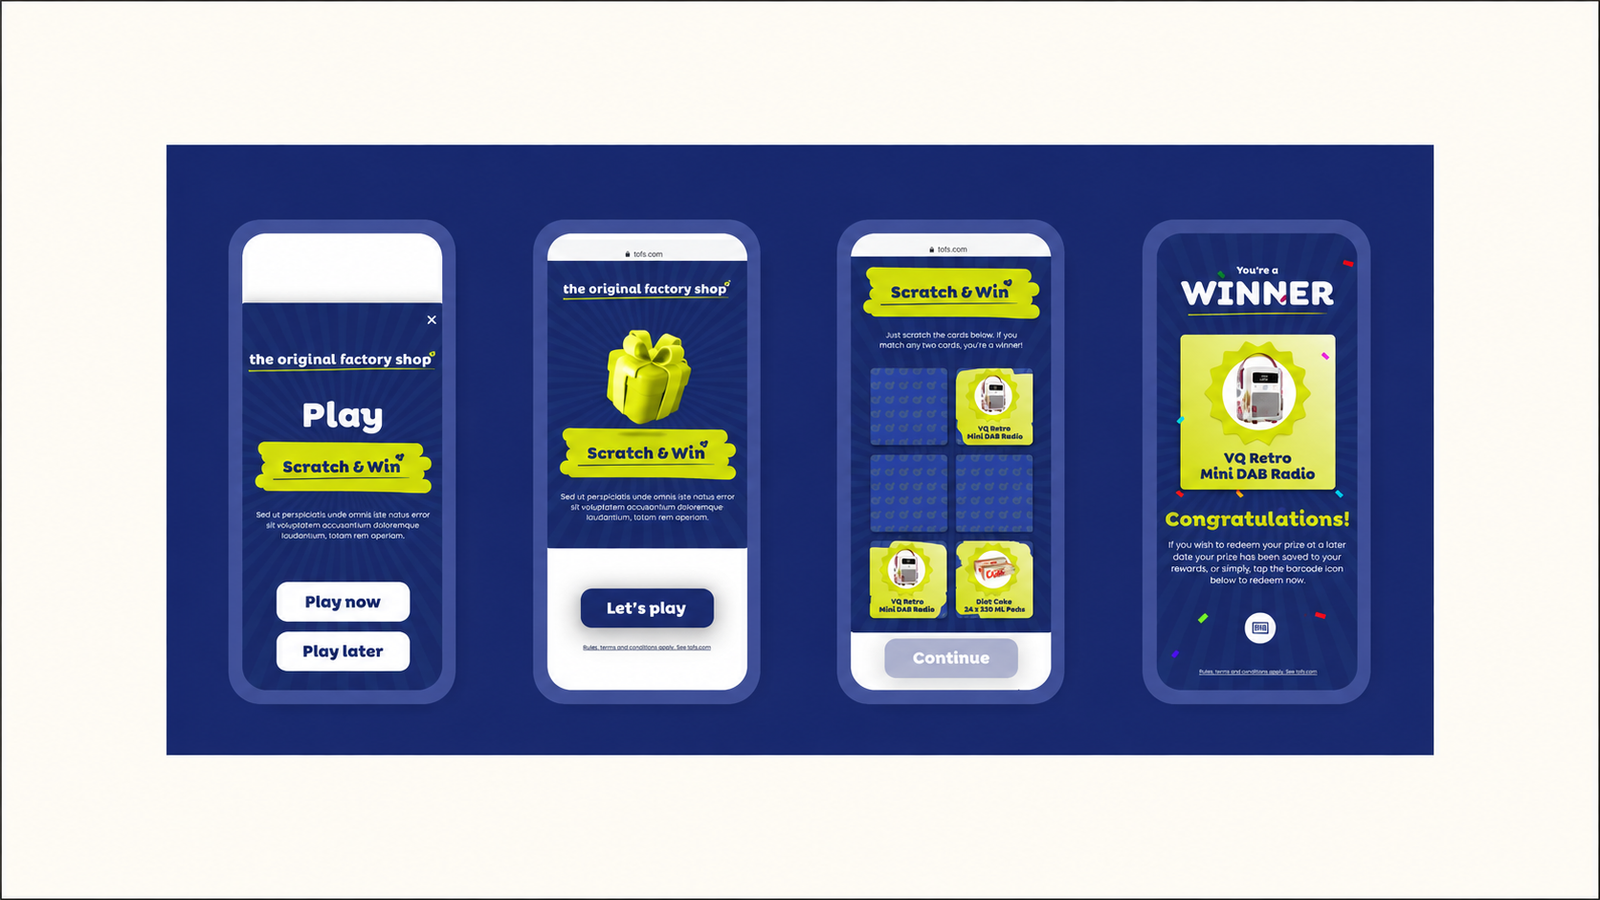
MCE Systems reports interactive content generating 52.6% higher engagement rates and twice as many conversions as static content. S2S Media independently reports interactive content producing 2x higher conversion rates compared to static content, alongside 4 to 5 times longer time on page. CleverTap's own research on interactive customer experiences found interactive content garnering 2x more engagement than static content specifically, and StriveCloud reports gamification lifting engagement by 100 to 150% compared to non-gamified environments, alongside a 54% increase in daily active users where gamification is well executed.
The specific conversion mechanics behind this: gamification has been shown to lift trial usage by 54% and buy-click rates by 15%, and applying game mechanics like progress bars and streaks specifically has been shown to increase user retention by up to 40% compared to non-gamified interfaces. The consistent "roughly 2x" conversion multiplier appearing across four independently published sources, from four different methodologies, is a stronger signal than any single study's headline number alone.
This lift is not universal, and the caveat matters as much as the number. Gamification's performance advantage is specific to categories where the underlying interaction genuinely benefits from anticipation and reward framing, not a general-purpose multiplier applicable to every screen in every app.
Time-to-First-Campaign
This metric compares two fundamentally different deployment models rather than two points on the same scale, and the comparison is worth stating in those terms rather than as a single number.
The engineering-dependent path. A trigger or in-app campaign requiring the standard release pipeline, a development ticket, code review, and app store approval, typically adds two to four weeks before a single real user sees the result, following the standard mobile release cadence most engineering teams already operate under. This is not a criticism of any specific team's velocity. It reflects the structural reality that a UI change compiled into an app's binary has to clear the same review gate regardless of how small the change actually is.
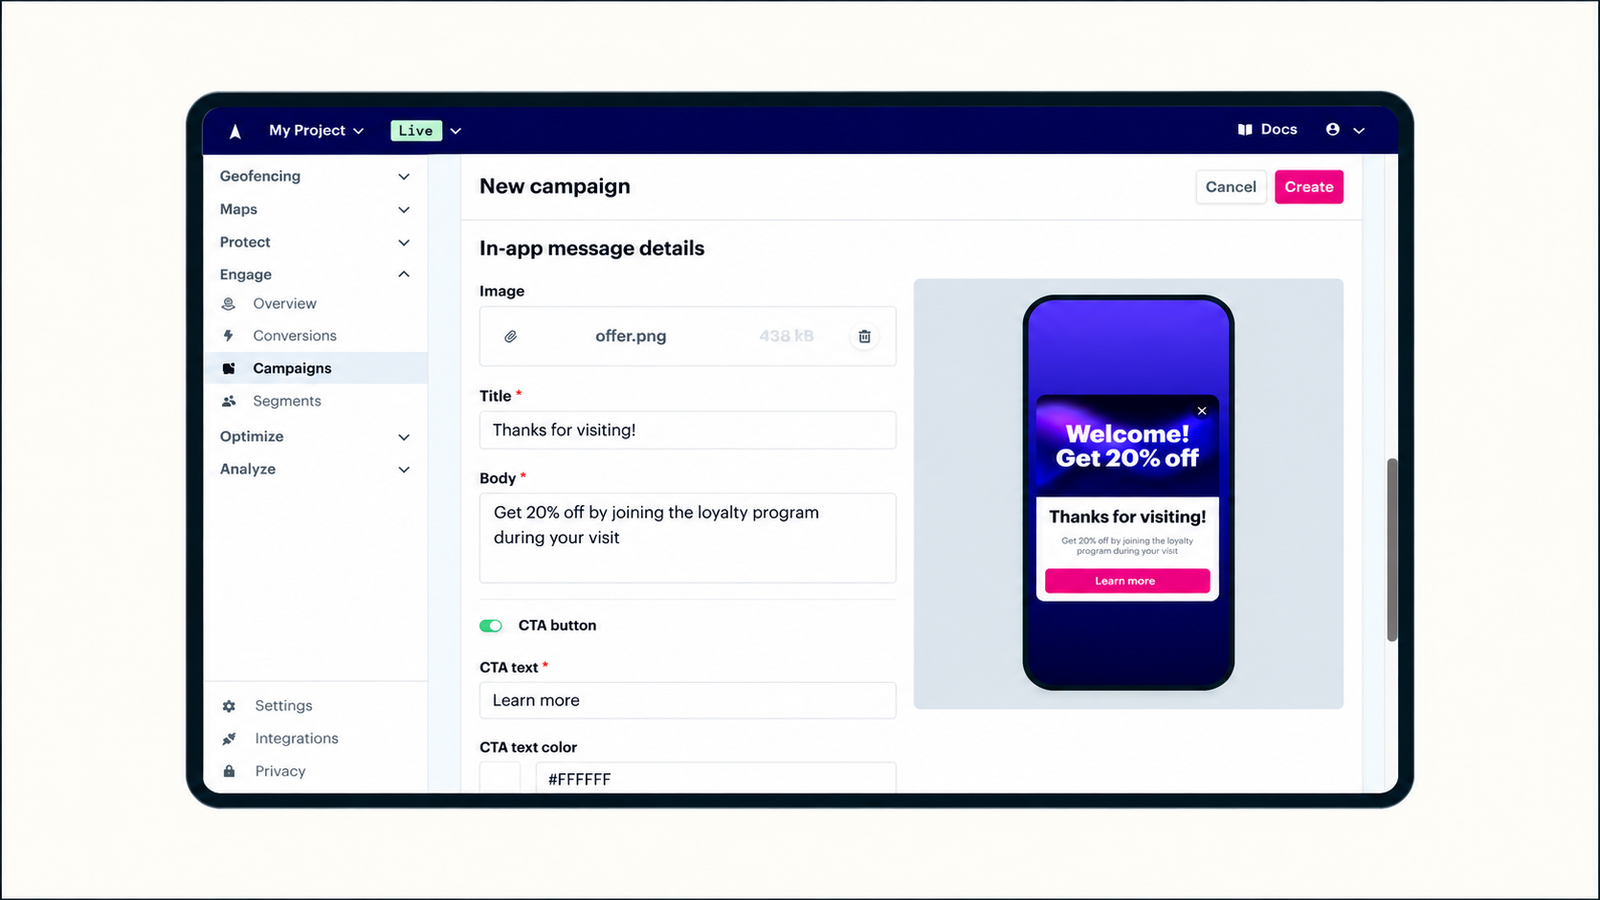
The no-code, server-driven path. Once a no-code in-app platform is integrated, SDK setup typically takes on the order of 20 minutes, with most teams shipping a first live campaign within 24 hours of completing that integration, since the campaign itself is configured through a dashboard and delivered without requiring a new app build or store review.
The practical business implication is not simply "faster is better" in the abstract. It is that the two-to-four-week engineering-dependent timeline makes testing a small, low-stakes idea, a single nudge's copy, a trigger's delay window, structurally uneconomical, since the fixed cost of shipping any change does not scale down for a small question. A 24-hour deployment window removes that structural disincentive entirely, which is the mechanism behind the broader experimentation-volume argument that no-code in-app platforms are generally built around.
Survey Response Rate by Trigger Type
This is the category with the most consistent, convergent data of anything in this report, with multiple independent sources landing on the same directional finding using different datasets.
Transactional surveys, triggered immediately after a specific user interaction, achieve 25 to 40% response rates, compared to 15 to 25% for relational surveys sent on a fixed schedule with no connection to a recent interaction. A separate analysis found transactional NPS surveys achieving 8 to 12 percentage points higher response rates than relational NPS specifically because they arrive immediately after an interaction while the experience is still fresh. Contextual, in-app surveys specifically have been measured at 3 to 5 times higher response rates than the equivalent survey delivered by email.
Format-level detail within in-app surveys specifically. In-app NPS response rates average 21.71% across Refiner's 2025 dataset, with timing and audience targeting determining whether a specific implementation lands closer to 15% or closer to 35%. CSAT, which asks about satisfaction with a specific interaction rather than overall product loyalty, outperforms NPS in the same dataset at a 26.29% average response rate, since a specific question about something the user just did is easier to answer than a general loyalty question about the product as a whole.
The consistent takeaway across every source in this category: the trigger's timing and specificity, not the survey's design or industry, is the primary driver of response rate. Industry has notably less impact on response rate than most teams assume, a healthcare organisation and a SaaS company both using email NPS see similar response rate ranges, even though their actual NPS scores differ significantly, which reframes the practical lever available to any team: optimising trigger timing produces a larger, more reliable improvement than optimising survey design or copy alone.
Topics Not in the Brief Worth Including
Survey fatigue has a documented frequency ceiling worth building into any trigger design. The consistent recommendation across multiple sources is capping transactional surveys at once per customer per 30 days maximum, since even a customer with five genuine interactions in a month should receive one survey, not five, as survey fatigue degrades response rate faster than imperfect timing does.
The response-rate metric itself needs a consistent denominator to be comparable across sources. Response rate should be measured as completed responses divided by surveys actually delivered, not surveys sent, since a mismatched denominator between two reports, or between a team's own internal tracking and an external benchmark, produces numbers that look comparable but are not measuring the same thing.
Bot and automated click contamination is a real, documented distortion specifically affecting benchmark comparisons involving email. Enterprise security tools that pre-scan email links for malware inflate reported email click-through figures with non-human activity, which means any direct comparison between in-app CTR and email CTR benchmarks should account for this asymmetry, since in-app engagement figures are not exposed to the same contamination.
Key Takeaways
CTR by format shows a consistent hierarchy across every independent source reviewed: promo-code and interstitial in-app formats outperform standard banners, which outperform push notifications by a wide margin, and this gap is measurably wider in the Indian market specifically, where push notification fatigue is documented as more severe than global averages.
Impression-to-click by vertical shows fintech and financial services producing the largest relative lift from behavioural, in-app-inclusive messaging, with two independent large-scale reports both placing fintech's conversion improvement at the top of the vertical ranking.
Gamification versus static content shows a remarkably consistent roughly 2x conversion multiplier across four independently published sources using different methodologies, which is a stronger signal than any single study's number in isolation, though the lift is specific to interaction types that genuinely suit anticipation and reward framing.
Time-to-first-campaign is best understood as two structurally different deployment models rather than a single spectrum: a two-to-four-week engineering-dependent release path versus a roughly 24-hour no-code, server-driven path, with the difference mattering most for the small, low-stakes experiments that an engineering-dependent path makes structurally uneconomical to test at all.
Survey response rate by trigger type is the most consistently documented finding in this entire report: transactional, contextually-triggered surveys outperform relational, scheduled surveys by roughly 10 to 15 percentage points across every source reviewed, and trigger timing matters more to response rate than industry, survey design, or channel alone.
Further Reading
From Digia Engage:
- In-App Surveys: How to Get a 30% Response Rate When Email Gets 3% - the full NPS and CSAT response rate dataset this report's survey section draws on
- In-App Messaging vs Push Notifications: Key Differences -the format-level CTR comparison this report's opening section builds on
- Why In-App Campaigns Convert 8x Better Than Email - the deeper mechanism behind the channel comparisons in this report
- Scratch Cards in Mobile Apps: Design, Timing, and Conversion Data - the specific gamification mechanic design principles behind the aggregate lift reported in this article
- No-Code In-App Campaigns: How Growth Teams Ship Without Developers - the full architecture behind the time-to-first-campaign comparison in this report
- Digia Engage Nudges - behaviour-triggered, native in-app formats configurable from a dashboard
External Sources:
- The Great Push Notifications Benchmark 2025 - Batch (format-level CTR data across Android and iOS, July 2024 to July 2025)
- Push Notifications Statistics 2026 - Business of Apps (rich vs simple push CTR; interstitial reaction rate data)
- RCS vs Push Notifications India 2026 - Scalify Labs (India-specific open rate comparison and the Diwali campaign case study)
- Customer Engagement Benchmarks for 2026 and Beyond - MoEngage (673 billion message analysis; vertical-level conversion lift data)
- Cross-Channel Marketing Strategies Boost Conversion Rates by up to 31% - CleverTap via Nasdaq (vertical-level conversion and stickiness data)
- Gamifying the User Experience to Drive More Promo Conversions on Mobile App - MCE Systems (interactive vs static conversion comparison)
- Interactive Content & Gamification: Engagement Strategies 2025 - S2S Media (independent conversion and time-on-page comparison)
- App Gamification Examples - CleverTap (interactive vs static engagement data)
- Gamification Examples: Mobile App Engagement - StriveCloud (engagement lift and retention data from progress bars and streaks)
- 50+ Gamification Statistics You Need to Know in 2026 - AmplifAI (trial usage and buy-click lift data)
- NPS Survey Response Rate: Benchmarks and Tips - Qualaroo (transactional vs relational NPS response rate benchmarks)
- NPS Survey Response Rates: Benchmarks by Channel - Zonka Feedback (transactional vs relational gap and industry-impact analysis)
- NPS Survey Timing Best Practices - Pelin (in-app vs email response rate multiplier)
- Transactional NPS Surveys: When to Send, Industry Triggers & Common Mistakes - Zonka Feedback (survey frequency capping recommendation)
- How to Improve Your NPS Response Rate - Perspective AI (response rate measurement methodology)
The behaviour-triggered nudges, surveys, and gamification mechanics referenced throughout this report are configurable natively in Digia Engage, deployable from a dashboard without engineering tickets after initial SDK integration. Book a demo to see how contextual triggering and format selection are configured against your own campaign goals, or read the in-app surveys guide for the full response-rate methodology this report's survey section draws on.
