
Mobile app analytics is often treated as a solved layer in the product stack. Teams integrate SDKs, define event schemas, connect dashboards, and assume they now have visibility into user behavior. On the surface, everything looks mature-hundreds of tracked events, real-time dashboards, and structured reports flowing across teams.
Yet a consistent pattern emerges across mobile products. Users install the app, open it once or twice, and then disappear. Retention stagnates, engagement feels inconsistent, and teams struggle to explain why this is happening. The issue is not a lack of data. It is a deeper misalignment between what is being measured and what actually reflects user progress.
Most mobile analytics systems are designed to capture activity, but product success depends on understanding outcomes.
The Core Misalignment: Activity vs Progress
At the center of ineffective analytics is a subtle but critical confusion. Teams believe they are measuring user behavior, but in reality, they are primarily measuring user activity. This distinction is not semantic-it directly impacts how decisions are made.
Activity-based measurement focuses on observable actions. It captures what users click, how often they open the app, and how long they stay. Progress-based measurement, on the other hand, evaluates whether users are moving toward a meaningful outcome. It asks whether the product is actually working for them.
This is where most analytics systems fall short. They provide high visibility into movement within the app, but very little clarity on whether that movement translates into value. As a result, teams optimize for engagement patterns without fully understanding if those patterns represent success or friction.
What Teams Typically Measure (And Why It Feels Sufficient)
Most mobile analytics implementations follow a familiar structure. They rely on standardized metrics that are easy to track, widely accepted, and supported by default in analytics tools. These metrics create a sense of completeness because they are quantitative, scalable, and comparable across products.
Common Mobile Analytics Metrics
| Metric | What It Captures | Implicit Assumption |
|---|---|---|
| Installs | Number of app downloads | Growth equals product adoption |
| DAU / MAU | Frequency of app usage | Usage reflects engagement quality |
| Session Length | Time spent per session | Longer sessions indicate satisfaction |
| Retention Rate | Users returning over time | Returning users are finding value |
| Event Tracking | Feature-level interactions | More interaction equals better usage |
While these metrics are useful for monitoring surface-level trends, they become problematic when treated as indicators of product success. Each of them relies on an assumption that does not always hold true in practice.
For instance, an increase in session length might suggest deeper engagement, but it could also indicate confusion or inefficient navigation. Similarly, a high number of sessions might reflect repeated attempts to complete a task rather than successful usage. Without understanding the context behind these metrics, teams risk drawing incorrect conclusions.
Where Traditional Metrics Break Down
The limitation of traditional metrics is not that they are incorrect, but that they are incomplete. They act as proxies for value without directly measuring it. This creates a layer of ambiguity that becomes dangerous when used for decision-making.
Installs, for example, are often celebrated as a growth signal. However, they only represent acquisition efficiency, not product adoption. A user downloading the app has not yet experienced any meaningful outcome. Treating installs as success conflates marketing performance with product performance.
Similarly, retention is often considered a north-star metric. While it indicates that users are returning, it does not explain what they are doing when they return. Without connecting retention to meaningful actions, it becomes a lagging indicator rather than a diagnostic one.
When metrics are used as substitutes for value instead of reflections of it, they create confidence without clarity.
The Missing Layer: Defining and Measuring Value
To move beyond surface-level analytics, teams need to explicitly define what value means within their product. Value is not a feature or a screen. It is the outcome a user achieves that justifies their continued use of the app.
In a food delivery app, value is not browsing menus but successfully placing an order. In a fitness app, value is not opening the app but completing a workout. In a finance app, value is not viewing a dashboard but gaining clarity about spending or saving.
Until this outcome is clearly defined, analytics remains disconnected from product reality. Events get tracked, dashboards get populated, but none of it answers the fundamental question: is the product working for the user?
The First Moment of Value (Activation)
One of the most critical concepts in value-driven analytics is the first moment of value, often referred to as activation. This is the point at which a user experiences the core benefit of the product for the first time.
It is important to distinguish this from onboarding completion. Completing onboarding simply means the user followed a sequence of steps. Activation means the user achieved something meaningful.
Examples of Activation Across App Categories
| App Category | First Moment of Value Example |
|---|---|
| Food Delivery | First successful order placed |
| Fitness App | First workout completed |
| Social App | First meaningful interaction (comment or reply) |
| Productivity App | First task completed |
| Finance App | First expense tracked or categorized |
Activation serves as the bridge between acquisition and retention. If users do not reach this point, retention metrics lose their significance because there was no value to retain in the first place.
Users do not return because they opened the app. They return because something worked.
Metrics That Actually Reflect Product Performance
Once value is defined, analytics can shift toward measuring how efficiently users reach and repeat that value. This introduces a set of metrics that are fundamentally different from traditional activity-based ones.
Time to Value (TTV) measures how long it takes for a user to reach their first meaningful outcome. In mobile environments, where user patience is limited, even small delays can significantly impact drop-off rates. A long time to value often indicates friction in onboarding or a lack of clarity in the product experience.
Activation Rate represents the percentage of users who successfully reach the first moment of value. This metric directly reflects how well the product delivers on its promise during initial usage. A low activation rate is usually a sign of misaligned onboarding, unclear messaging, or excessive cognitive load.
Pre-value drop-off focuses on where users abandon the journey before experiencing value. Unlike generic funnel analysis, this metric ties drop-offs specifically to the failure to reach meaningful outcomes, making it far more actionable.
Value repetition rate tracks how often users return to perform the core value action again. This is a strong indicator of habit formation and long-term retention. If users experience value once but do not repeat it, the product may be delivering value inconsistently.
Activity Metrics vs Value Metrics: A Structural Difference
| Dimension | Activity Metrics | Value Metrics |
|---|---|---|
| Focus | User actions | User outcomes |
| Interpretation | Context-dependent | Context-rich |
| Insight Depth | Surface-level | Behavioral and intent-driven |
| Decision Impact | Often ambiguous | Directly actionable |
| Optimization | Engagement loops | User success |
This comparison highlights that the issue is not about replacing activity metrics entirely. Instead, it is about repositioning them as supporting signals rather than primary indicators. Value metrics should anchor decision-making, while activity metrics provide additional context.
Why Most Mobile Analytics Systems Fail
The failure of mobile analytics systems is rarely due to a lack of tools or technical capability. It is usually rooted in how these systems are designed and implemented.
Many teams adopt an event-first approach, where the focus is on tracking as many interactions as possible. This leads to bloated event taxonomies that are difficult to interpret and rarely tied to meaningful outcomes. The question becomes “what can we track?” instead of “what should we understand?”
Another common issue is tool-driven thinking. Analytics platforms come with predefined dashboards and templates, which subtly shape how teams think about metrics. As a result, teams inherit generic measurement frameworks that may not align with their specific product.
There is also often a disconnect between product and analytics teams. When analytics is treated as a reporting function rather than a strategic one, metrics lose their connection to real product decisions. This creates dashboards that are descriptive but not actionable.
Finally, fragmentation across teams leads to conflicting priorities. Marketing may optimize for installs, product teams for engagement, and leadership for retention. Without a shared definition of value, these metrics pull the organization in different directions.
Building a Value-Driven Analytics System
Shifting toward meaningful analytics requires a deliberate redesign of how measurement is approached. It begins with defining the core value action-the single outcome that proves the product works for the user. This action must be observable, measurable, and repeatable.
Once defined, the next step is to map the user journey leading to this value. This involves identifying key steps, potential friction points, and moments where users may hesitate or drop off. Unlike traditional funnels, this is a value path that focuses on outcomes rather than just transitions.
Instrumentation should then be aligned with intent. Instead of tracking generic interactions, events should reflect meaningful progress. For example, tracking “task completed” provides far more insight than tracking “button clicked.”
Equally important is organizational alignment. All teams-product, growth, and analytics-should operate with a shared understanding of value and prioritize the same core metrics. This ensures consistency in decision-making and reduces metric fragmentation.
Finally, analytics systems should be treated as evolving frameworks. As the product changes and user behavior shifts, definitions of value may need to be updated. Continuous validation ensures that metrics remain relevant and accurate.
Practical Example: Rethinking a Fitness App Dashboard
A traditional fitness app dashboard might focus on metrics such as daily active users, session duration, and feature clicks. While these metrics indicate activity, they do not reveal whether users are actually improving their fitness or achieving their goals.
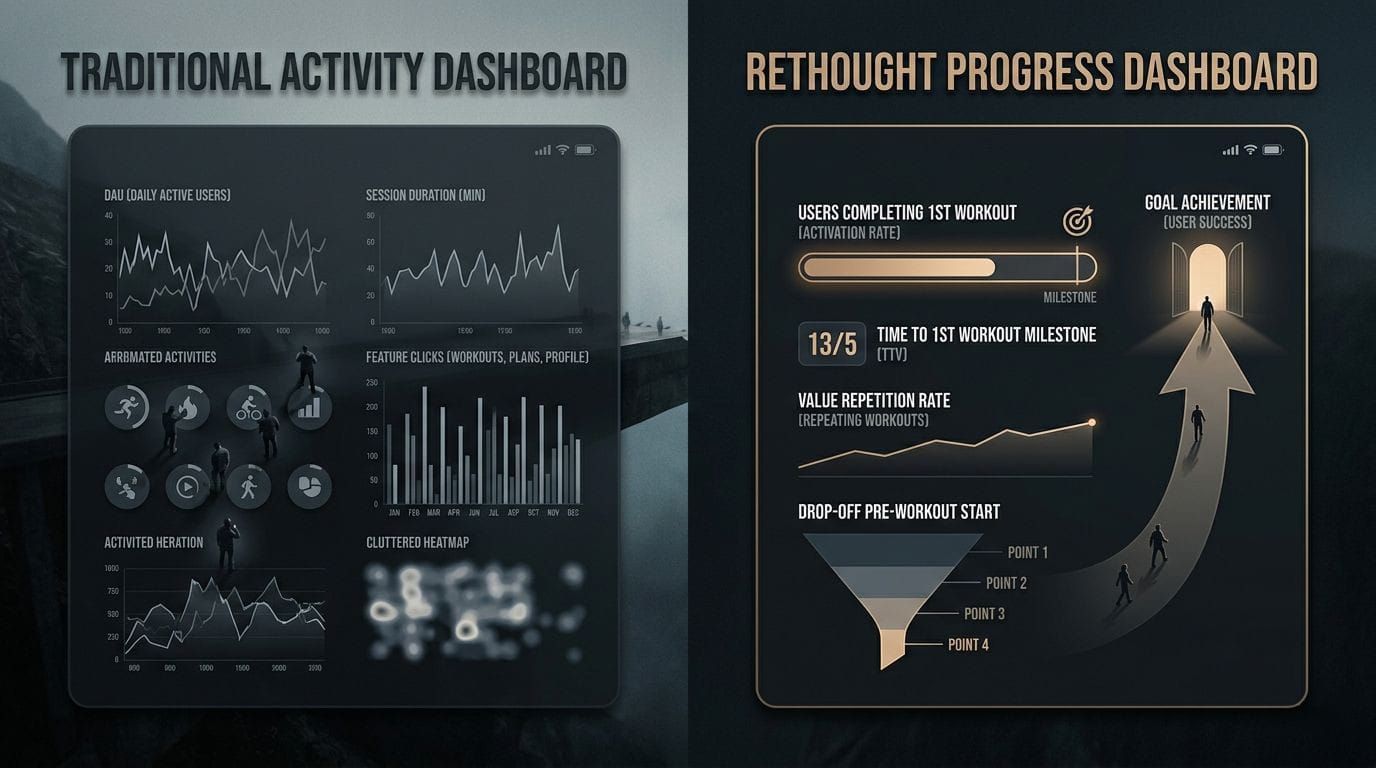
A value-focused dashboard, in contrast, would track the percentage of users completing their first workout, the time taken to reach that milestone, and how frequently users return to complete additional workouts. It would also highlight where users drop off before starting a workout.
This shift transforms analytics from a passive reporting tool into a system that directly informs product decisions. Instead of asking whether users are active, the focus becomes whether users are progressing.
Key Takeaways
Mobile app analytics often fails not because of insufficient data, but because of misplaced focus. Activity metrics dominate dashboards, creating visibility without clarity. As a result, teams optimize for engagement patterns that may not reflect real user success.
Defining and measuring the first moment of value provides a foundation for meaningful analytics. Metrics such as Time to Value, Activation Rate, and Value Repetition offer deeper insights into how users experience the product.
Ultimately, the goal of analytics is not to track everything, but to understand what matters. When measurement aligns with user outcomes, product decisions become more precise, onboarding becomes more effective, and retention becomes a natural result of delivering value.
Final Perspective
Mobile app analytics is not a data problem. It is a thinking problem.
Teams that continue to measure activity will keep optimizing for surface-level engagement. Teams that shift toward measuring value will start understanding behavior at a deeper level.
That shift is what separates products that are merely used from products that are truly adopted.