
Mobile app funnel analysis is often treated as a reporting layer. Teams define steps, measure conversion rates, and track where users drop off. Dashboards get filled with percentages, and over time, patterns begin to emerge.
Yet despite all this visibility, most teams still struggle to answer a simple question:
why are users dropping off, and what does it actually mean?
Users install the app, move through a few steps, and then disappear. Nothing breaks. Nothing crashes. The funnel shows decline, but it does not explain failure. The issue is not the absence of data. It is that most funnel analysis stops at observation instead of understanding.
A funnel shows where users drop. It does not explain why they drop.
What is Mobile App Funnel Analysis?
Mobile app funnel analysis is the process of tracking how users move through a defined sequence of steps toward a specific outcome, and identifying where and why users drop off before completing that outcome.
It measures how efficiently users progress by analyzing conversion rates between steps, drop-off rates at each stage, and the time taken between key actions. The purpose of funnel analysis is not just to measure movement, but to identify friction and improve conversion by helping users reach value more efficiently.
Funnel analysis becomes meaningful only when it explains why users fail to progress, not just where they drop.
The Structure of a Mobile App Funnel
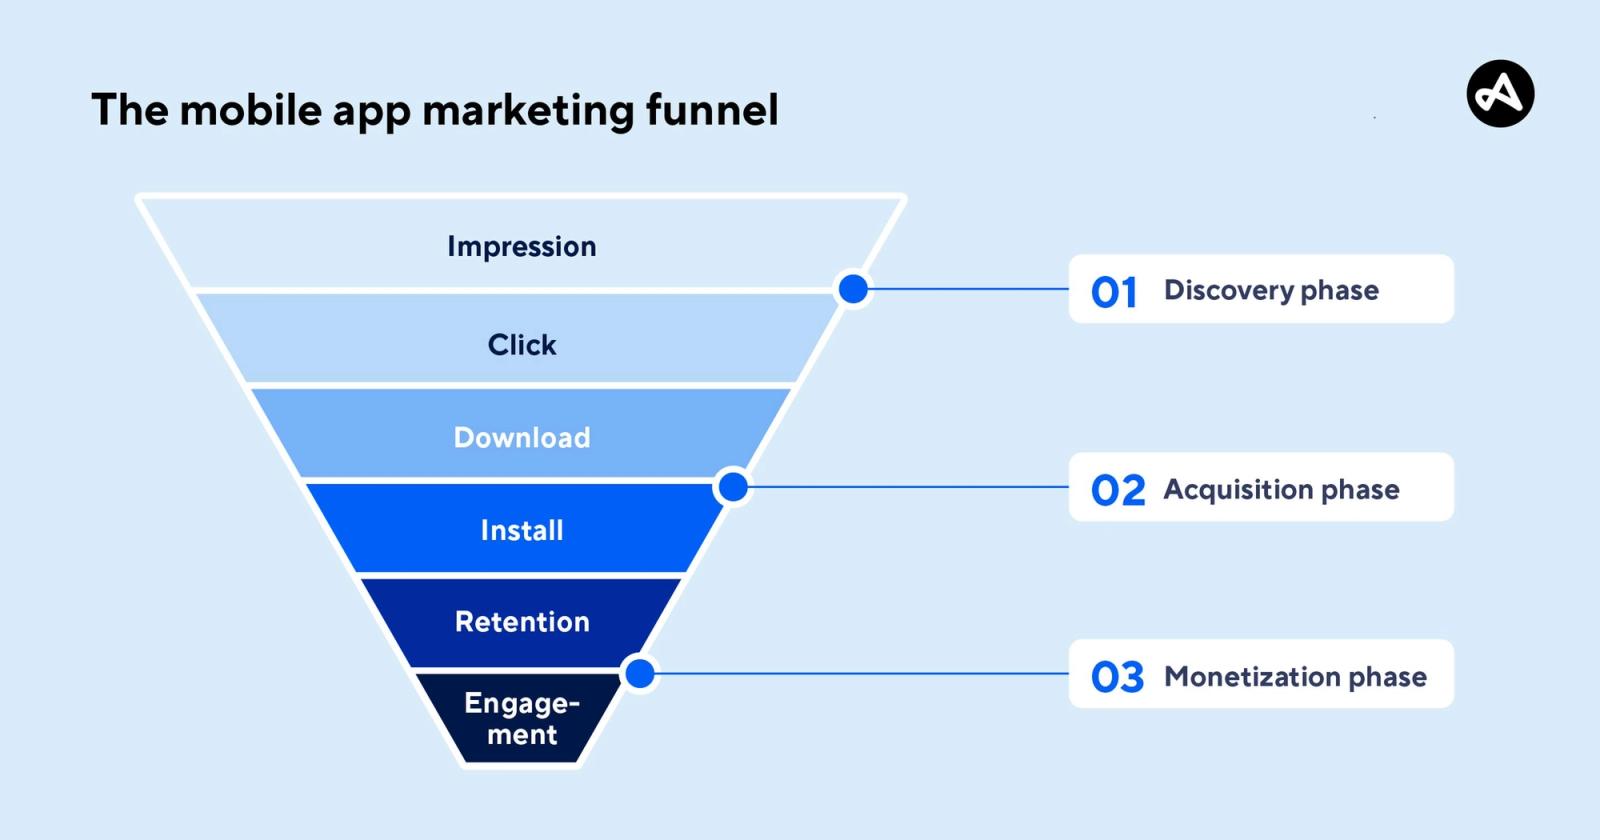
A funnel represents a sequence of user actions that lead to a defined outcome. This outcome is typically tied to product value, such as completing onboarding, placing an order, or making a financial transaction.
Example: Basic Mobile App Funnel
| Stage | User Action |
|---|---|
| Install | App downloaded |
| Signup | Account created |
| Onboarding | Initial setup completed |
| Activation | First meaningful action completed |
| Conversion | Core outcome achieved |
Each step represents a transition. Between each transition lies a decision point where users either continue or drop off.
The Funnel Analysis Gap: Where vs Why
Most funnel analysis focuses on identifying where users drop off. However, meaningful insights come from understanding why the drop-off happens.
| Layer | What It Answers | Limitation |
|---|---|---|
| Where | At which step users drop | Descriptive only |
| Why | What caused the drop | Actionable insight |
A funnel that only shows drop-off is incomplete. A funnel that explains friction becomes a tool for decision-making.
Funnel analysis without friction analysis leads to optimization without direction.
Types of Drop-Off in Mobile Funnels
Not all drop-offs are the same. Each type reflects a different kind of problem within the product.
Friction-based drop-off occurs when users encounter usability issues or unnecessary complexity. This includes long forms, unclear navigation, or technical interruptions that break the flow. These problems are usually solvable through UX improvements.
Intent mismatch drop-off happens when user expectations do not align with the product experience. This often stems from misleading messaging or unclear value propositions. In this case, the issue is not interface design but positioning.
Value delay drop-off occurs when users do not experience meaningful value early enough. If the product does not demonstrate usefulness quickly, users disengage before reaching activation.
Decision fatigue drop-off happens when users are overwhelmed by too many choices or unclear next steps. This is especially common in onboarding flows and commerce journeys.
Users don’t drop off randomly. They drop off where the product stops helping them.
Funnel Metrics That Actually Matter
To understand funnel performance, teams need to focus on metrics that explain progression and friction rather than just activity.
Conversion Rate Between Steps
Conversion Rate=Users completing next step/Users in previous
Drop-Off Rate
Drop-off Rate=1−Conversion Rate
Time Between Steps
This measures how long users take to move forward. Delays often signal hesitation or confusion.
Activation Rate
Activation measures how many users reach the first meaningful outcome, directly linking funnels to value.
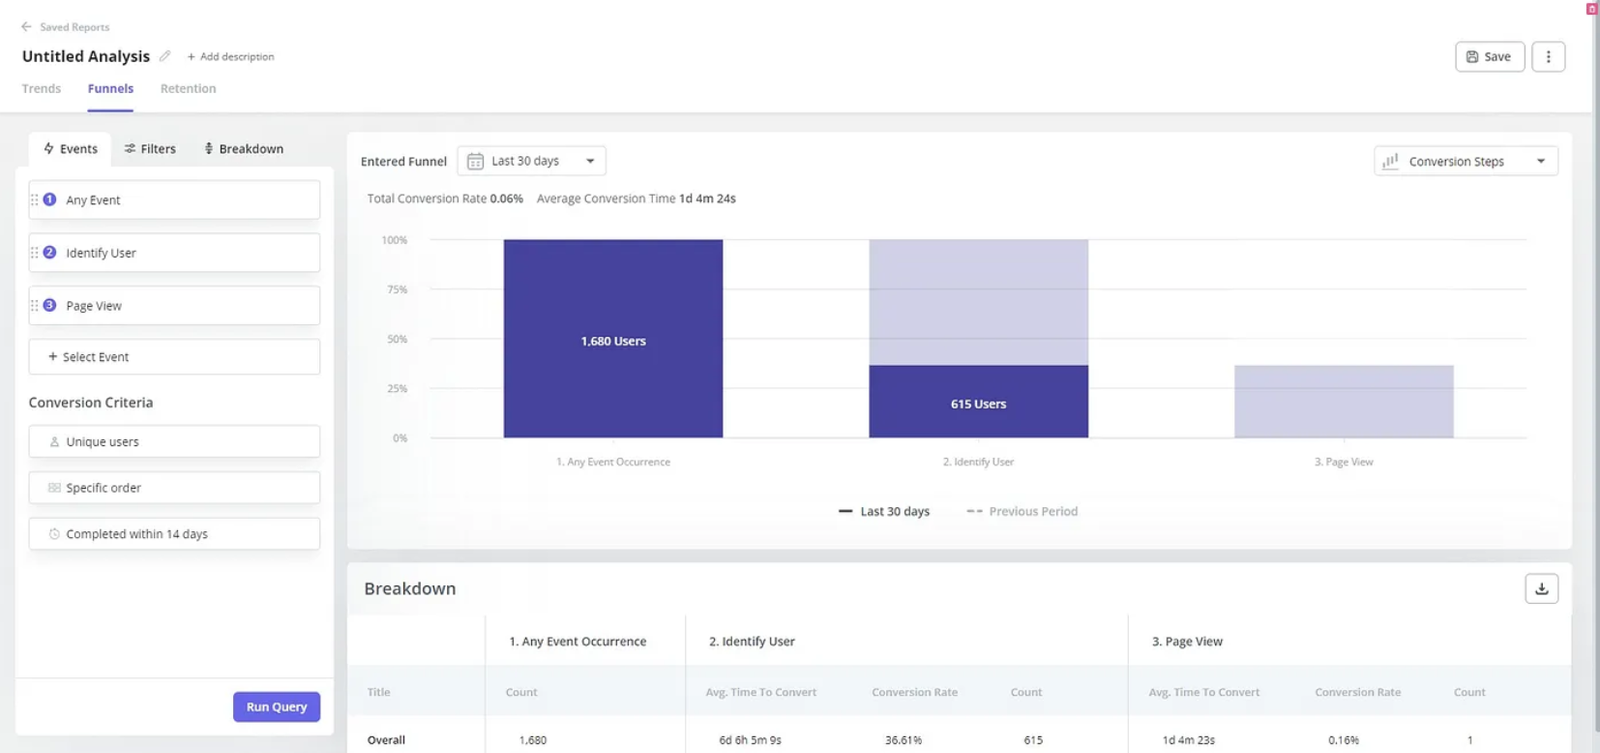
How to Identify Drop-Off in a Mobile App Funnel
Identifying drop-off requires more than observing percentages. It requires a structured approach that connects user movement to underlying causes.
The process begins with defining the core outcome that represents success within the product. The user journey is then broken into measurable steps that lead to this outcome.
Conversion rates are calculated between each step to identify where users fail to progress.
The next step is to analyze time delays between actions, which often reveal hesitation or confusion. Finally, friction must be investigated through behavioral patterns, UX evaluation, and intent alignment. This ensures that drop-off is not just detected, but understood.
Connecting Funnels to Value
Most funnels are built around product steps rather than user outcomes, which creates a disconnect between movement and meaning.
A value-driven funnel shifts focus toward outcomes instead of navigation.
| Stage | Value-Oriented Action |
|---|---|
| Entry | App opened |
| Setup | Intent established |
| Activation | First value experienced |
| Retention | Value repeated |
The goal of a funnel is not completion. It is successful outcomes.
Usage is Contextual: Funnels Differ by Category
Funnel analysis must adapt to the type of product being built. Usage patterns and drop-offs behave differently across categories.
In social media apps, funnels are driven by interaction depth rather than linear steps. The transition from passive scrolling to active participation is where real drop-off happens.
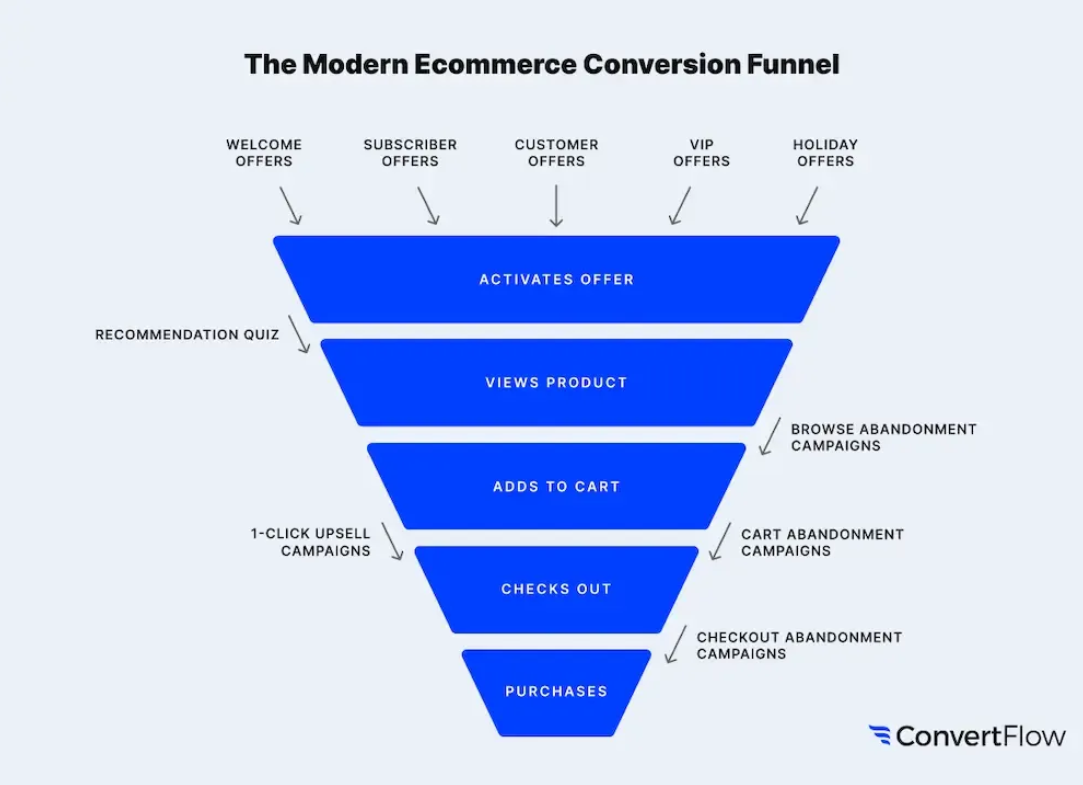
In D2C and commerce apps, funnels are conversion-driven. However, browsing behavior often inflates activity without indicating intent, making it necessary to separate window shoppers from buyers.
In fintech apps, funnels are tied to financial commitment. Drop-offs often occur at trust-heavy stages such as verification or first transaction, where psychological friction plays a major role.
Usage is defined by value actions within the category, not by generic engagement metrics.
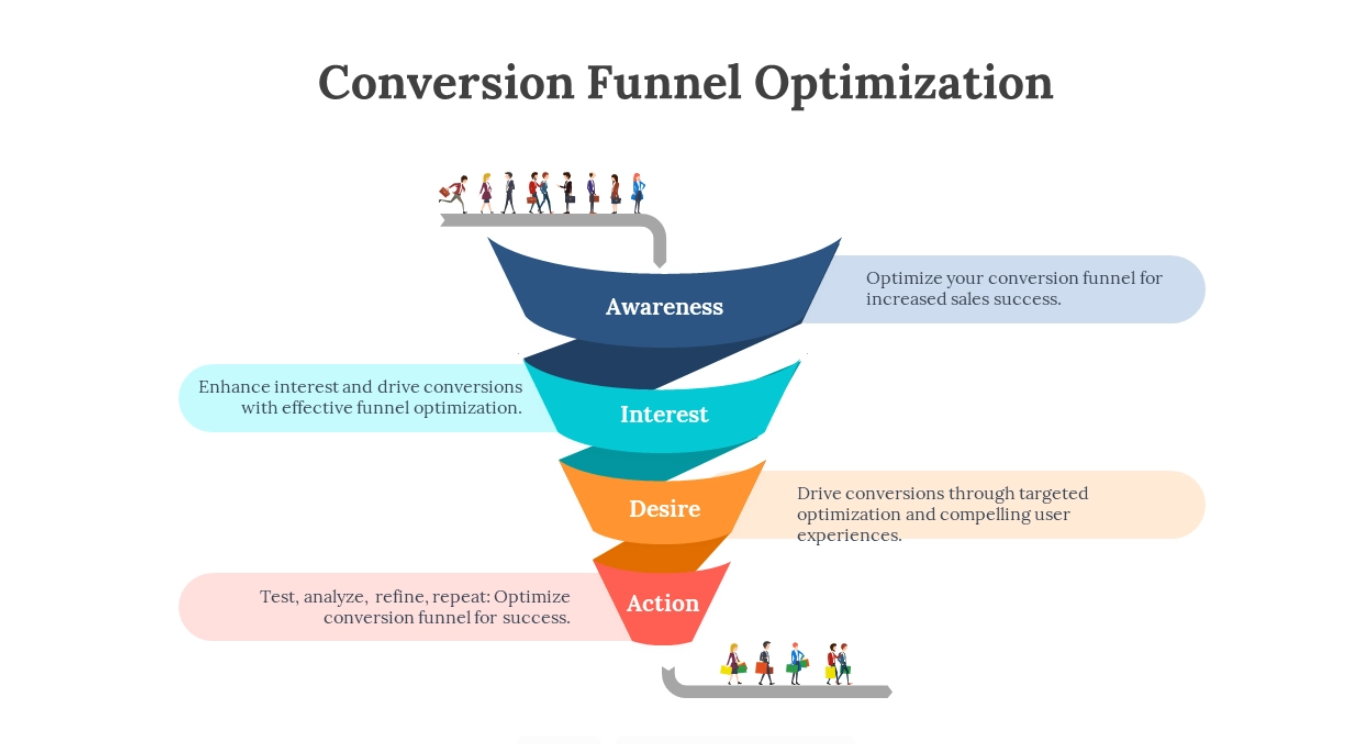
How to Improve Funnel Conversion
Improving conversion is not about pushing users forward. It is about removing friction and making progress easier.
Reducing unnecessary steps simplifies decision-making. Making the next action clear removes hesitation. Delivering value earlier increases motivation to continue.
When users understand what to do and why it matters, conversion improves naturally.
Conversion improves when friction is removed, not when users are forced forward.
Common Funnel Problems and How to Fix Them
| Funnel Problem | Likely Cause | Recommended Fix |
|---|---|---|
| High onboarding drop-off | Too many steps or complexity | Simplify onboarding flow |
| Low activation rate | Value not clear early | Reduce time to value |
| Browsing without conversion | Low purchase intent | Segment high-intent users |
| Checkout abandonment | Decision friction or hidden costs | Improve pricing clarity |
| Low repeat usage | Weak value reinforcement | Improve core experience |
Key Principles of Effective Funnel Analysis
Funnel analysis becomes significantly more effective when guided by a few core principles.
Funnels should be designed around value rather than just steps. Drop-off should always be analyzed alongside friction, not in isolation. Not all drop-offs are problems, as some reflect low user intent.
Conversion improves when user effort decreases, and metrics should aim to explain behavior rather than simply describe it.
Every drop-off point is a signal. The mistake is treating it as just a number.
Final Perspective
Mobile app funnels are often treated as linear paths, but real user behavior is far more complex. Users explore, hesitate, compare, and make decisions based on both logic and perception.
The goal of funnel analysis is not to force users through predefined steps. It is to understand where the product fails to support their intent.
When funnels are structured around value and analyzed with context, they become more than just metrics. They become a system for diagnosing product problems and improving real user outcomes.