
Acquiring mobile app users has become easier than ever. Marketers can rely on channels such as App Store Optimization (ASO), paid advertising, influencer marketing, referral campaigns, and partnerships to generate large numbers of installs. A well-executed acquisition strategy can quickly push an app to the top of the charts.
However, installs alone rarely determine whether an app succeeds.
Many apps experience a surge of downloads during launch or marketing campaigns, only to see most of those users disappear within days. Without a strategy to keep users engaged after installation, growth becomes temporary and marketing spend produces diminishing returns.
This is where mobile app retention becomes the defining growth metric.
Retention measures how many users continue returning to an app after installing it. It reflects whether users actually find value in the product and whether the experience is compelling enough to become part of their routine. Apps that master retention transform short-term installs into long-term engagement, sustainable revenue, and loyal user communities.
In this guide, we explore how retention works, which metrics matter, what benchmarks look like across the industry, and what strategies product teams can use to improve user loyalty.
Mobile App Retention Key Statistics
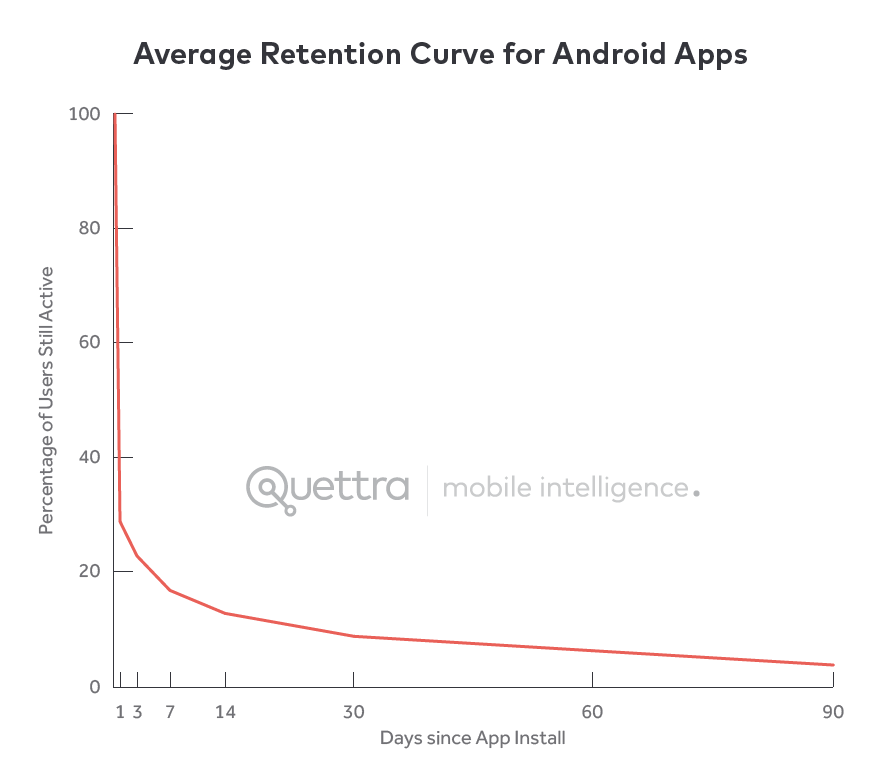
Understanding the scale of retention challenges requires looking at real industry data. Numerous studies show that user drop-off happens extremely quickly after installation, which means the first few days of the user lifecycle are the most critical for product success.
Across 31 app categories, the average retention rate is around 25.3% on Day 1, meaning three out of four users disappear within the first 24 hours. By Day 30, the average retention rate drops to approximately 5.7%, illustrating how difficult long-term engagement can be.
The following table highlights typical retention benchmarks across platforms.
| Metric | iOS | Android |
|---|---|---|
| Average Day 1 Retention | 25.65% | 23.01% |
| Average Day 7 Retention | ~12% | ~11% |
| Average Day 30 Retention | 4.13% | 2.59% |
Engagement metrics reveal similar patterns. A DAU/MAU ratio of around 20% is generally considered healthy for mobile apps, while ratios above 25% indicate exceptional stickiness.
Several additional statistics reveal how quickly engagement can deteriorate without proper retention strategies.
| Metric | Industry Average |
|---|---|
| Users lost within first 3 days | 77% |
| Month-1 churn rate | 55% |
| Month-3 churn rate | 68% |
| Retention boost from in-app messages | Up to 30% |
| Long-term user probability when engaging weekly | 90% |
These benchmarks demonstrate that retention is not a secondary metric—it is the central challenge of mobile product growth.
What Is Retention?
Mobile app retention refers to the number of users who continue to open and use an app after installing it. Rather than focusing on downloads, retention focuses on ongoing engagement over time.
In practice, retention is usually measured by tracking how many users return to the app after specific time intervals, such as Day 1, Day 7, and Day 30 following installation. These time windows provide insight into both short-term engagement and long-term loyalty.
A simple way to think about retention is that it measures how many users remain active compared to how many originally installed the app.
If a large percentage of users continue returning, the app is likely providing real value and delivering a strong user experience. If retention drops rapidly, it suggests there may be issues with onboarding, usability, performance, or perceived value.
Retention is closely tied to another key metric: lifetime value (LTV). Apps with strong retention typically generate higher lifetime value because users remain active long enough to interact with features, consume content, or make purchases.
Why Mobile App Retention Matters for Sustainable Growth
Retention plays a central role in determining whether an app achieves sustainable growth or fades into obscurity.
User acquisition is becoming increasingly expensive. As competition intensifies, marketers must spend more to attract new users through advertising and promotional campaigns. If those users abandon the app shortly after installing it, the acquisition investment fails to produce long-term returns.
Strong retention changes this equation.
When users continue returning to an app, several positive outcomes emerge simultaneously. First, loyal users interact with more features and generate more opportunities for monetization. Second, the product becomes part of users’ daily routines, increasing engagement stability. Third, satisfied users often recommend the app to others, creating organic growth through referrals.
In many cases, improving retention by just a few percentage points can dramatically increase revenue because users remain engaged long enough to convert into paying customers.
User Retention vs User Acquisition
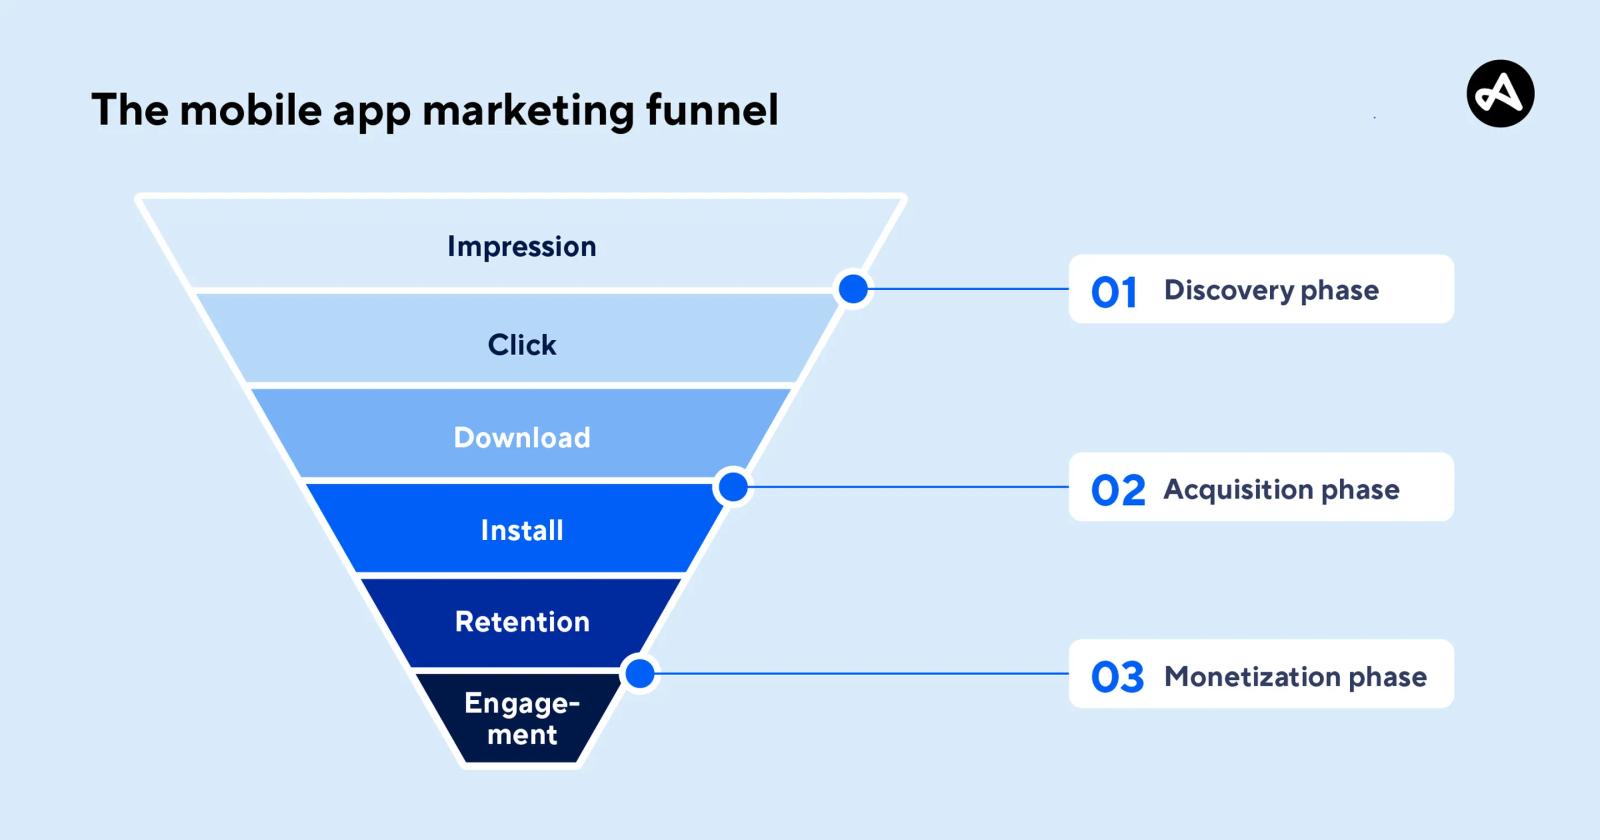
Retention and acquisition represent two sides of the same growth strategy, but they serve different purposes within the product lifecycle.
User acquisition focuses on attracting new users to the app. This stage involves marketing activities such as paid ads, influencer collaborations, referral incentives, and app store optimization. Acquisition determines how many people discover and install the app.
Retention, by contrast, focuses on keeping those users engaged after installation. It ensures that new users continue interacting with the product and gradually become loyal customers.
The relationship between acquisition and retention can be visualized through the mobile growth funnel.
| Growth Stage | Objective |
|---|---|
| Acquisition | Attract users to install the app |
| Activation | Help users understand value through onboarding |
| Engagement | Encourage regular interaction with features |
| Retention | Convert active users into loyal customers |
An app can grow rapidly through acquisition, but without retention the growth is temporary. Sustainable success occurs when both strategies work together.
Let’s Get to Grips With Some Key Terms and KPIs
Measuring retention requires understanding several core engagement metrics. These indicators help product teams track user behavior and identify opportunities to improve the experience.
Active Users and DAU/MAU Ratio
Active users represent the number of unique individuals who interact with an app during a defined time window. Product teams commonly measure engagement through Daily Active Users (DAU) and Monthly Active Users (MAU).
DAU measures how many users open the app within a 24-hour period, while MAU measures the number of users who interact with the app over a 30-day period. Comparing these two numbers reveals how frequently users return.
The DAU/MAU ratio, sometimes called the stickiness ratio, indicates the percentage of monthly users who engage with the app daily. Higher ratios suggest stronger user habits and more consistent engagement.
Churn Rate
While retention measures the users who stay, churn measures the users who leave.
Churn typically includes both users who uninstall the app and users who stop opening it entirely. It provides valuable insight into the stages of the user journey where engagement declines.
The churn rate can be calculated by dividing the number of users lost during a specific period by the number of users present at the start of that period. High churn often indicates product issues such as poor onboarding, confusing workflows, or insufficient value.
Session Length and Time Spent In-App
Another important engagement indicator is how long users spend interacting with the app.
Session length refers to the duration of a single visit, while time spent in-app reflects the cumulative amount of time users spend across sessions. These metrics provide insight into whether users find the product engaging or useful.
However, longer sessions do not always mean positive engagement. Sometimes users spend more time because they struggle to complete tasks or encounter confusing processes. For this reason, session metrics should always be analyzed alongside usability data.
Screen Views
Screen views track which sections of the app users interact with most frequently. By analyzing screen view data, product teams can identify which features attract the most attention and which parts of the interface cause drop-offs.
This information is extremely valuable for optimizing the user experience. Screens that receive little engagement may require redesign or repositioning, while high-performing features can be expanded to increase value.
User Lifetime Value (LTV)
User Lifetime Value represents the total revenue a user generates throughout their relationship with the app.
Calculating LTV helps businesses determine how much they can afford to spend on acquiring and retaining users. Apps with strong retention typically achieve higher LTV because users remain active longer and interact with more monetization opportunities.
What Is Good App Retention?
Retention benchmarks vary widely depending on the category of the app, the platform being used, and the user behavior within that industry.
Research across mobile categories shows that Day-1 retention averages around 25–26%, while Day-7 retention drops to around 11–12%. By Day 30, retention often falls to approximately 6% across both iOS and Android platforms.
These numbers may appear low, but they reflect typical user behavior in mobile ecosystems where users frequently experiment with new apps.
Certain categories outperform others. News apps, for example, often achieve Day-1 retention rates exceeding 30% because users return frequently to consume updated content.
Because retention patterns vary significantly across industries, the best way to evaluate performance is by comparing results with direct competitors within the same category.
Benefits of Getting Mobile App Retention Right
When retention strategies are executed successfully, they create a series of positive outcomes for the product and the business behind it.
High retention signals strong customer satisfaction. Users who repeatedly return to the app likely find the experience useful, enjoyable, or valuable.
Retention also increases profitability. Loyal users generate more transactions, view more advertisements, and subscribe to premium services more frequently than short-term users.
Another major advantage is cost efficiency. Retaining existing users is generally much cheaper than acquiring new ones through paid campaigns. As retention improves, businesses can allocate fewer resources to acquisition while still maintaining steady growth.
Finally, satisfied users often become advocates for the product. Word-of-mouth recommendations and referrals can significantly expand the user base without additional marketing costs.
Best Practices for High Retention Rates
Retention strategies evolve throughout the user lifecycle. The process typically begins with onboarding, progresses through habit formation, and eventually leads to long-term loyalty.
Several proven strategies help improve retention.
Master UA and UX
Retention begins with aligning marketing promises with product experiences. When acquisition campaigns set realistic expectations and the app delivers on those expectations immediately, users are more likely to remain engaged.
A seamless user interface, fast performance, and clear value proposition all contribute to stronger retention outcomes.
Onboarding
The onboarding experience determines whether users understand the value of the app during their first session.
Successful onboarding flows guide users through key features while minimizing friction. When users quickly see how the app solves their problem, they are far more likely to return.
In-App Messaging
In-app messages help guide users through the product experience while they are actively interacting with it. These messages can introduce features, highlight new content, or provide helpful reminders.
When implemented thoughtfully, in-app messaging can increase retention by up to 30 percent.
Push Notifications
Push notifications allow apps to communicate with users even when they are not actively using the product. However, poorly timed or irrelevant notifications can quickly become intrusive.
Effective push notification strategies rely on personalization, contextual messaging, and thoughtful timing.
Make Use of Deep Linking
Deep linking improves the user journey by directing users to specific content within the app rather than generic landing screens.
For example, a user clicking on a promotional campaign can be taken directly to the product or feature being promoted, reducing friction and increasing the likelihood of conversion.
Leverage Owned Media
Owned communication channels such as push notifications, email newsletters, and SMS campaigns provide powerful tools for re-engagement.
Because these channels are controlled directly by the brand, they allow companies to communicate with users without relying on paid advertising platforms.
Segmentation and Cohort Analysis
Not all users behave the same way. Segmenting users based on demographics, behavior patterns, or engagement levels allows product teams to design more personalized experiences.
Cohort analysis helps track how these different groups behave over time, enabling more precise optimization strategies.
Test, Analyze, and Optimize
Continuous experimentation is essential for improving retention.
Product teams should regularly test different messaging strategies, onboarding flows, feature placements, and engagement tactics. Data collected from these experiments can reveal which strategies generate the highest engagement levels.
Habit Formation and Engagement Hooks
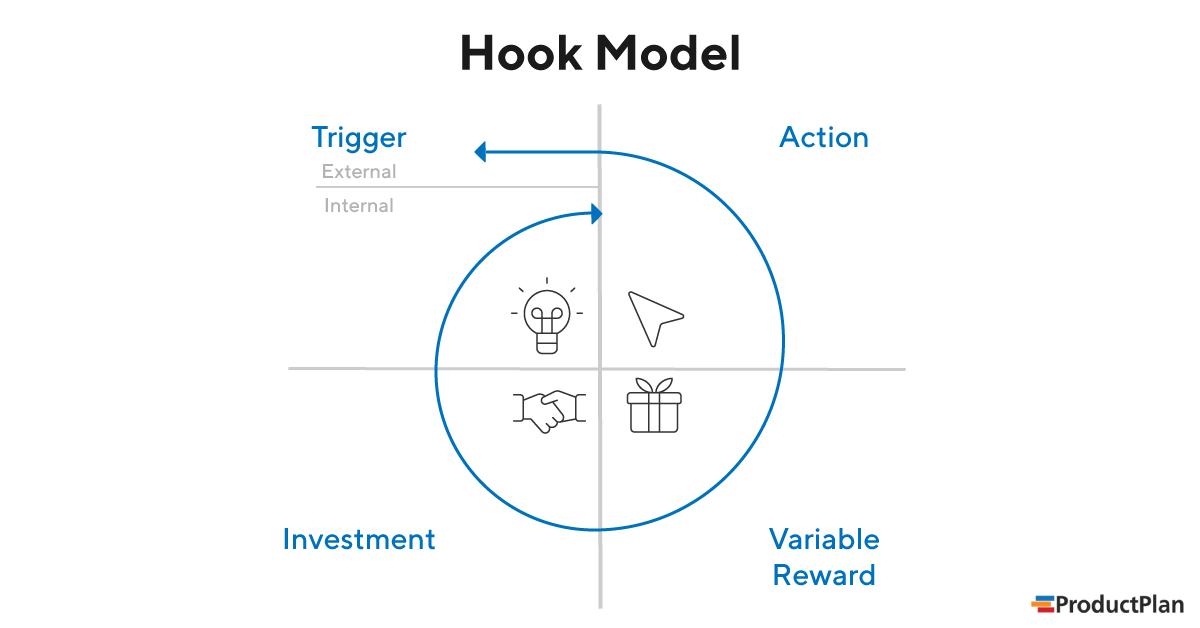
Successful apps often rely on behavioral design principles to encourage habit formation.
The engagement hook model includes four stages:
| Stage | Description |
|---|---|
| Trigger | A cue that prompts the user to open the app |
| Action | The behavior the user performs |
| Reward | The value the user receives |
| Investment | User actions that increase future engagement |
When these stages are carefully designed, users begin returning automatically without needing external prompts.
Invest in Re-Engagement
Even loyal users occasionally become inactive. Re-engagement campaigns help bring these users back through targeted notifications, personalized offers, or content updates.
Research shows that users who interact with an app at least once per week are significantly more likely to become long-term users.
Top Mobile App Retention Companies
Improving retention often requires specialized tools and analytics platforms. Many organizations rely on dedicated mobile engagement platforms that help manage user communication, personalization, and behavioral insights.
Popular solutions include platforms focused on engagement automation, analytics, and user experience optimization. These tools allow product teams to better understand user behavior and design more effective retention strategies.
Key Takeaways
Mobile app retention measures how many users continue using an app after installation. It is one of the most important indicators of product health and long-term success.
Industry benchmarks show that most apps lose a large percentage of users within the first few days. As a result, improving onboarding experiences and delivering early value are critical priorities.
Retention strategies should focus on creating meaningful user experiences, encouraging habit formation, and maintaining consistent engagement through personalized communication.
Ultimately, apps that succeed in retention transform temporary downloads into loyal user communities and sustainable business growth.