
TL;DR: RFM is a 30-year-old framework that still works because it ranks users by what they actually do, not what they say they will do. In mobile, it requires translation: Recency maps to meaningful engagement events, Frequency maps to your core action cadence, and Monetary requires a proxy signal for apps that do not transact. This article covers how to build the model, which five segments to act on, what to do with each one, how to run it in CleverTap, and where the model's real limits are.
What RFM Actually Is
RFM was developed for direct mail marketing in the 1990s. Arthur Hughes described it in Strategic Database Marketing as a way to rank mailing lists by expected response. The fact that it survived 30 years of channel shifts, platform fragmentation, and privacy changes is not nostalgia. It persists because the underlying logic is structurally sound.
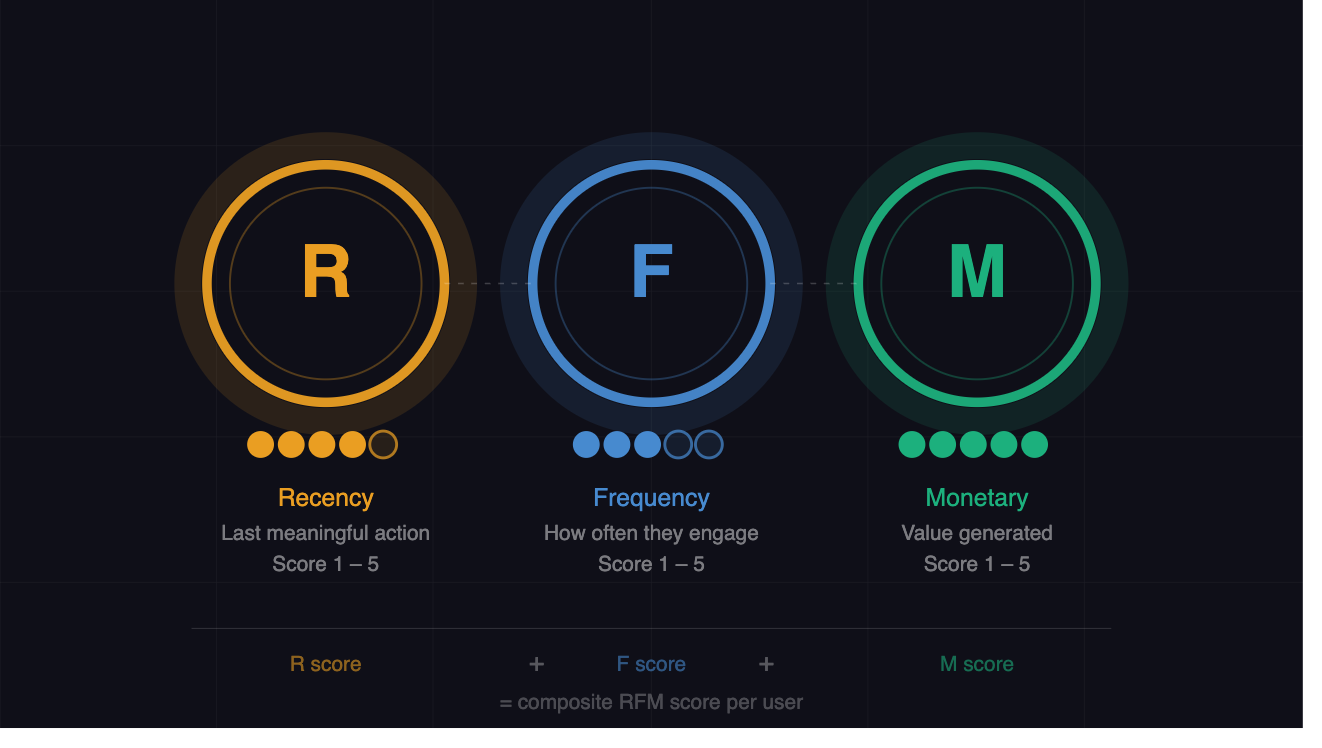
The framework segments users by three behavioral dimensions.
Recency is how recently a user performed a meaningful action. A user who opened your app yesterday is far more likely to respond to a campaign than one who opened it six months ago. Recency decays, and the decay is not linear.
Frequency is how often a user performs that action within a defined window. Repeat behavior signals habit formation. A daily user and a monthly user are categorically different, even if their last session happened on the same day.
Monetary is how much value the user generates. For transactional apps this is revenue. For non-transactional apps, it requires a proxy signal, which we cover in detail below.
The logic behind all three dimensions is the same: recent activity signals current interest, frequent activity signals habit, and higher monetary value signals economic importance. Combined, the three scores rank users by likely responsiveness and actual value.
RFM is also self-correcting. As behavior shifts, scores shift. A Champion who stops engaging will drift toward At-Risk. A dormant user who returns will climb back. The model reflects the current state of the relationship, not a snapshot from when the user installed the app.
It requires no external data. The inputs are your own event logs.
Why Most Mobile Teams Underuse It
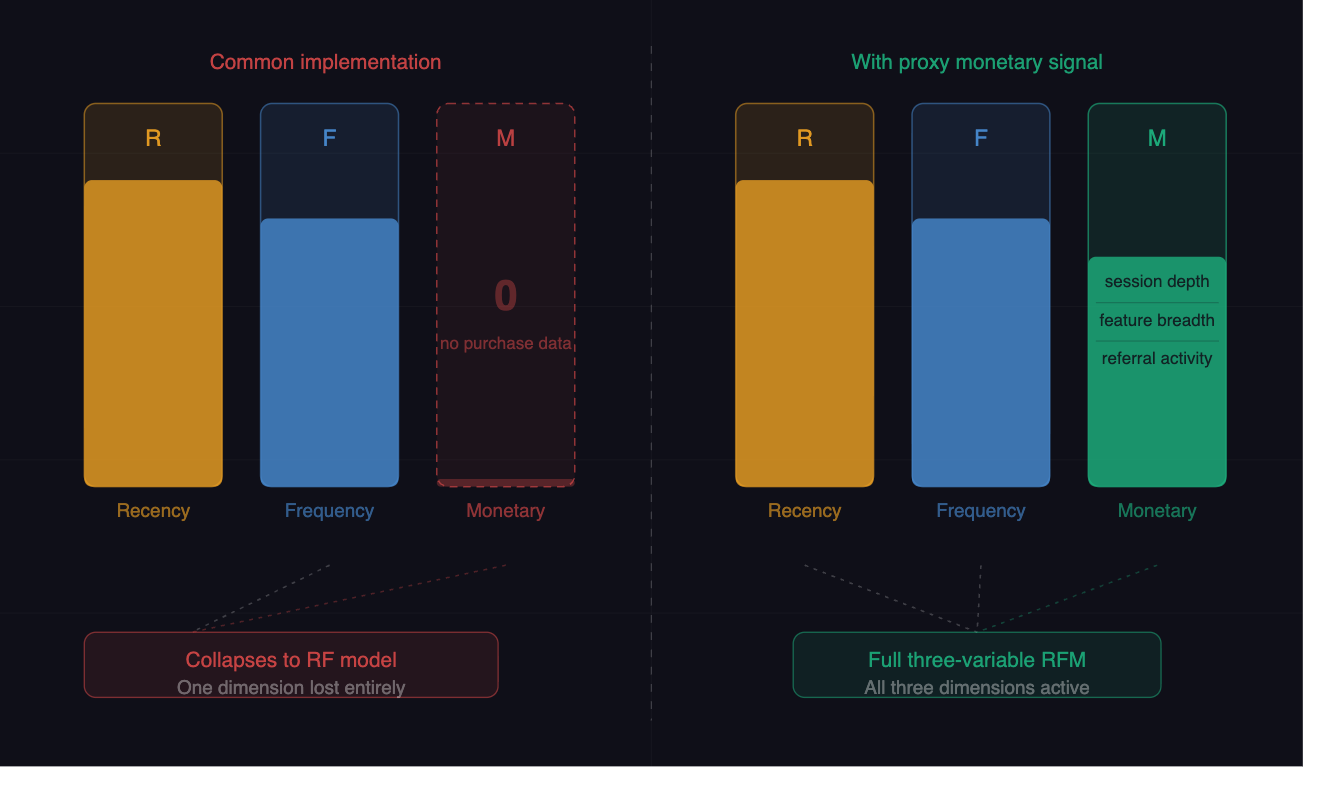
RFM is widely known but poorly implemented in mobile contexts for one primary reason: the original model was built on purchase transactions, and most mobile apps do not work that way.
Teams either apply it as-is (with all non-transactional users scoring zero on the Monetary dimension, which collapses the model to a two-variable analysis), or they skip it entirely in favor of custom cohort definitions that are harder to maintain and impossible to benchmark.
Neither outcome is necessary. The framework translates cleanly to mobile once you understand which events map to which dimensions and how to construct a proxy Monetary signal. The rest of the mechanics remain identical.
Translating RFM for Mobile: Which Events Map to Each Dimension
Recency
Recency should map to your most meaningful engagement event, not just any app open. A passive session start is a weak signal.
CleverTap defaults to app open as the recency event, which is a reasonable starting point for engagement-heavy apps. For transactional apps, use the last transaction or last action inside the primary value flow as the recency anchor. For content apps, use the last content completion rather than the last scroll.
What counts as "recent" also depends on your product's natural usage cadence. A daily habit app has a much tighter acceptable recency window than a travel booking app where once every few months is completely normal. Set your recency thresholds based on your product's observed engagement distribution, not an arbitrary 30-day calendar window.
Frequency
Frequency counts how many times the recency event occurred within your analysis window. The analysis window itself shapes what you find. A 30-day window suits daily-use apps. A 90-day window fits apps with weekly or irregular usage cycles. The window should cover at least two to three natural usage cycles for your product.
| App Type | Frequency Event |
|---|---|
| Fintech / Trading | Transactions or portfolio reviews per period |
| Media / Content | Content items consumed per session |
| Health / Fitness | Workout or session completions |
| E-commerce | Browsing sessions with product interactions |
| Gaming | Levels played or sessions per week |
Monetary
Monetary is the most context-dependent dimension. For transactional apps, it is total revenue, transaction value, or subscription tier. For everything else, you need to construct a proxy.
Monetary Without Transactions: Proxy Signals for Non-Transactional Apps
This is the step most teams skip, and skipping it degrades the model.
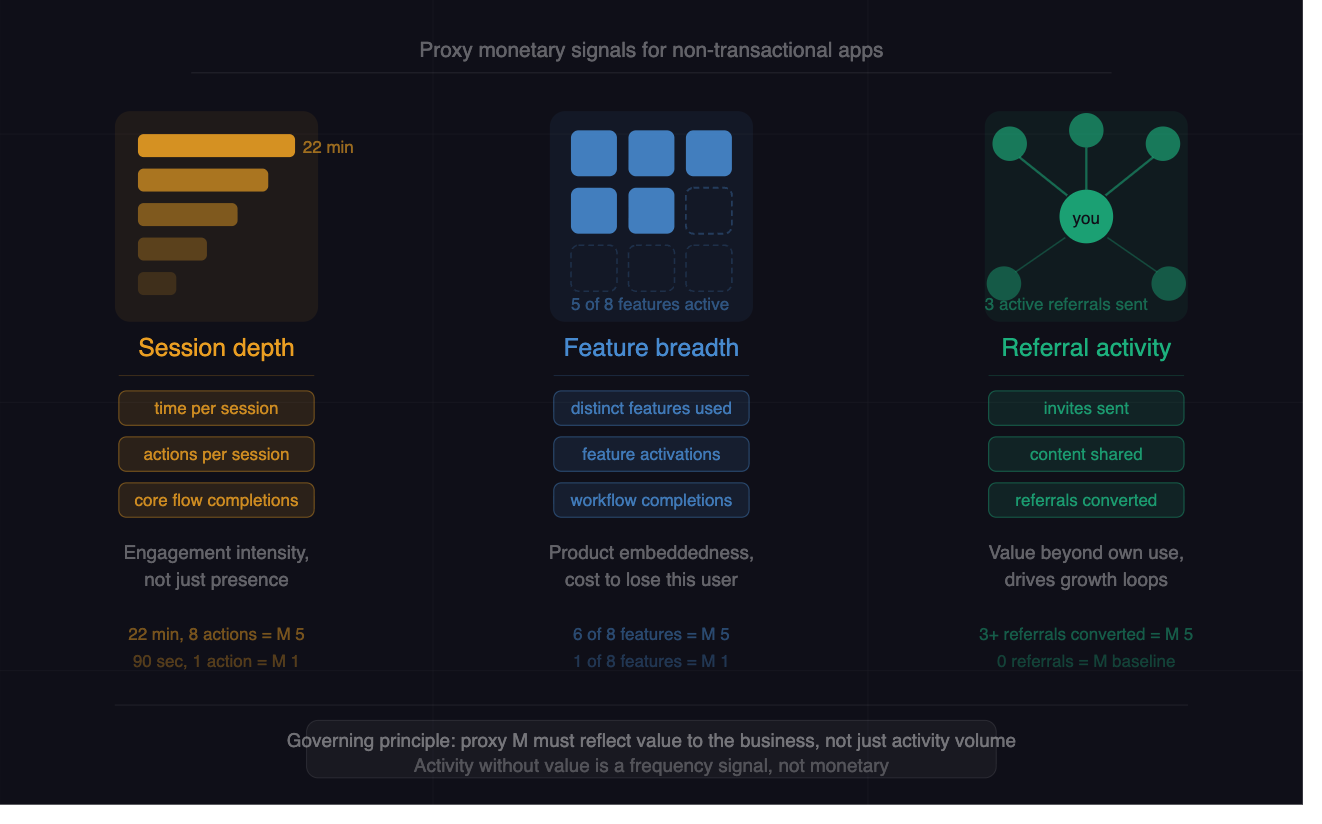
Three categories of proxy signals work well across most consumer mobile apps.
Session depth captures engagement intensity rather than just presence. Total time spent per session, or number of meaningful actions completed per session, distinguishes a user who runs through your core flow from one who opens the app and immediately closes it. A user averaging 22 minutes per session and completing 8 core actions is materially more valuable than one averaging 90 seconds.
Feature usage breadth reflects how deeply embedded your product is in a user's life. A user who has activated 6 of your 8 core features has a higher organizational cost to lose than one who only uses a single feature. Modern implementations adapt RFM for subscription and usage contexts by using MRR, ARPU, or margin for Monetary, but in freemium mobile products, meaningful engagement events such as workflow completions, feature activations, or active days serve as an effective substitute.
Referral and social activity captures value the user generates for the product beyond their own engagement. Invites sent, shares made, and referrals completed are legitimate monetary signals for apps where growth loops depend on peer acquisition. A user who has brought three paying users to your app is worth more than their session data alone suggests.
The governing principle: your proxy Monetary score should reflect how much value this user generates for the business, not just how active they are. Activity without value is a frequency signal. Proxy Monetary requires a genuine value link.
How to Build the Scoring Model
Building an RFM model is a four-step process.
Step 1: Define your events and analysis window. Choose one primary event per dimension. Set an analysis window that fits your usage cadence. Experts recommend at least six to twelve months of historical data to establish meaningful thresholds, though you can start with less if your app is newer.
Step 2: Calculate raw values per user. Pull three values for each user across the window: days since last recency event, count of frequency events, and sum or score of the monetary signal.
Step 3: Score using quantile-based bucketing. The standard methodology uses a 1-5 scale with quintile splits. The top 20% of users on each dimension receive a score of 5, the next 20% receive a 4, and so on. For Recency, the direction inverts: fewer days since last engagement means a higher score. A user who opened yesterday gets R=5. One who last appeared 180 days ago gets R=1.
Each user ends up with a three-digit RFM code: 5-4-3, 2-2-1, and so on. You can compute a weighted composite score or keep the three-digit code for finer segmentation work.
Step 4: Collapse into actionable segments. 125 possible RFM combinations are not operationally manageable. Group them into five to seven segments that drive distinct campaign strategies. CleverTap's automated RFM engine produces 10 automatic segments ranging from Champions to Hibernating users. For most mobile growth teams, five segments is the practical working set.
The Five Segments That Actually Matter
Different tools use different labels. The behavioral definitions below are what actually drive strategy.
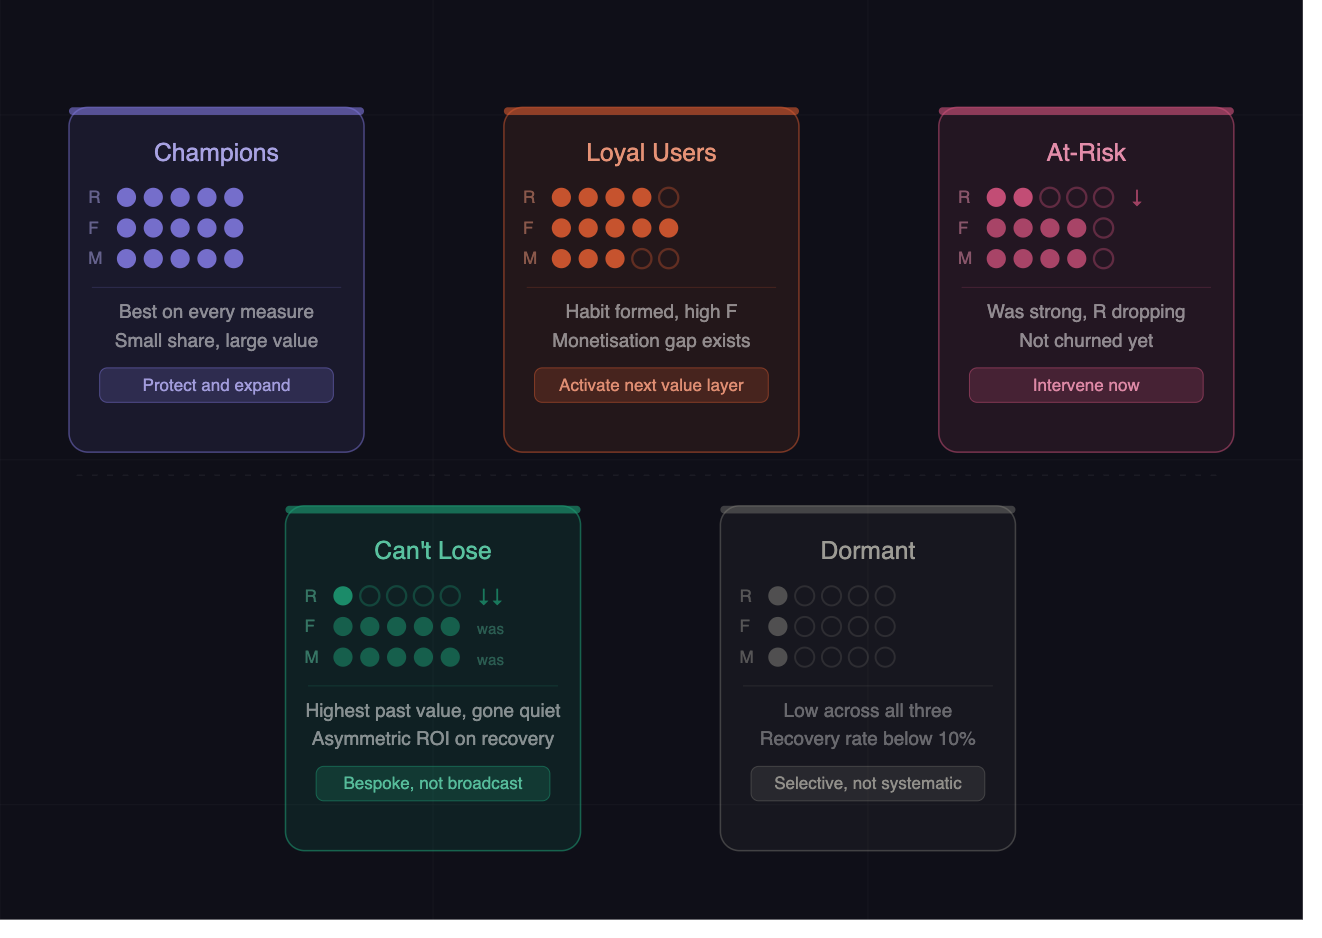
Champions (High R, High F, High M)
Your best users on every measure. They engaged recently, they engage often, and they generate the most value. Champions typically represent a small share of total users but account for a disproportionate share of revenue and engagement. The risk with this segment is not acquisition, it is neglect. Teams focus campaign attention on reactivation and ignore their highest-value active users. Champions who feel unacknowledged drift toward Loyal and then toward At-Risk without any obvious triggering event.
Loyal Users (High F, Moderate-High R, Moderate M)
These users show up consistently. Frequency is their defining characteristic. They have formed a habit with your app. The gap between Loyal and Champion is often a monetization or feature activation gap, not an engagement gap. They are candidates for value expansion: more features used, a paid tier upgrade, or a referral program.
At-Risk (Historically High F and M, Declining R)
This segment is the most operationally important in the model. These users were engaged and valuable, but their recency score has dropped. They have not churned yet, but they are moving in that direction. The defining signal is the delta: their historical behavior was strong, and something changed. They stopped showing up. At-Risk users still remember your product and likely have no hard decision made. They are recoverable with the right intervention at the right moment.
Can't Lose (High Historical M and F, Very Low R)
The asymmetric ROI of the model sits here. Can't Lose users were your most valuable users at some point and have since gone completely quiet. They are a small share of the base but a large share of historical value at risk of competitive defection. The window for easy recovery has already passed. Recovery probability is lower than At-Risk, but the return on a successful reactivation is substantially higher.
Dormant (Low R, Low F, Low M)
These users never built a meaningful relationship with your product, or if they did, it was long ago and at low depth. Recovery rates from this segment are the lowest of any group, and that is an accurate reflection of reality, not a modeling failure. Mass reactivation campaigns sent to Dormant users generate noise in your delivery infrastructure, waste budget, and can damage your push notification permission rates with carriers.
What to Do with Each Segment
Knowing the segments is half the work. Execution varies substantially across each group.
Champions: Protect and expand
The goal is not just reward, it is sustaining the relationship so it does not quietly erode.
Campaign strategy: loyalty recognition, early access, exclusive features, referral and ambassador programs. The objective is to make Champions feel the relationship is reciprocal.
Message content: acknowledge their engagement without making it read like a retention tactic. Specific value delivery works. Generic "you're one of our top users" language reads like marketing.
In-app format: Champions are already inside the app. Use that moment rather than a push notification. Gamification mechanics, milestone rewards, and feature announcements delivered contextually outperform broadcast messages for this segment. Digia Engage's gamification products, including streak trackers, scratch cards, and milestone badges, are built for exactly this kind of in-app recognition.
Loyal Users: Activate the next value layer
These users are habit-formed but typically underutilizing the product.
Campaign strategy: feature adoption nudges, upsell to premium tiers, cross-sell adjacent capabilities.
Message content: show specifically what they are missing based on their existing usage pattern. "Users who do X also get value from Y" is more effective than a generic feature announcement.
In-app format: contextual tooltips, bottom sheets, and banners triggered by the features they already use. Digia Engage's nudge products fire on real user actions rather than a fixed schedule, which is the right trigger logic for feature discovery.
At-Risk: Intervene with speed and specificity
The window is narrow. At-Risk users are still reachable and still remember your product. The intervention has to happen before they cross into Can't Lose.
Campaign strategy: personalized reactivation tied to their specific usage history. The message needs to arrive before they make a hard decision to stop.
Message content: reference their past behavior specifically. "You had a 14-day streak in March, your progress is still there" outperforms "we miss you." Specificity signals that this is a message about them, not a broadcast.
In-app format: push notification to bring them back into the app, followed immediately by an in-app experience that surfaces their most-used features or past progress. The first session after a gap must deliver value quickly. If it does not, you have wasted the reactivation.
Expected recovery rates: with targeted, timely campaigns, At-Risk reactivation of 20-40% is achievable. Waiting until users have been inactive for 60 days instead of 14 days roughly halves that rate.
Can't Lose: Bespoke, not broadcast
This segment does not belong in a mass campaign. A personalised, direct outreach sequence to a small set of high-value lapsed users will consistently outperform a broad campaign to thousands of ordinary lapsed ones. The ROI math on a focused win-back for Can't Lose users typically exceeds the ROI of reactivation campaigns targeting ten times as many lower-value lapsed users.
Message content: acknowledge the gap directly. Show what has changed since they were last active. New features, resolved problems, and improved experiences are all relevant. Assuming they left because of a specific friction point and addressing it directly is more effective than a generic win-back offer.
In-app format: if they return to the app, the first session experience should feel premium. Special recognition of their historical status can help re-anchor the relationship.
Expected recovery rates: 10-20% for well-targeted Can't Lose campaigns. Low probability, high value per recovered user.
Dormant: Be selective, not systematic
Do not send Dormant users the same reactivation campaign you send At-Risk users. For a subset of Dormant users who show any recent signal, a targeted last-chance message before permanently removing them from active campaign audiences makes sense. For the rest, this is a data hygiene exercise more than a recovery exercise.
Expected recovery rates: below 10% for the broad Dormant population.
RFM Segment Migration: The Signal Most Teams Ignore
A static RFM score tells you where a user is. Migration data tells you where they are going.
A user moving from Champion to At-Risk across two consecutive analysis periods is a materially different signal than a single At-Risk label. The trajectory reveals that a relationship is actively deteriorating, not just that a user happens to score in the At-Risk range.
CleverTap's RFM transition view lets you track users who have moved from one segment to another over a defined period. This is where the model shifts from reporting to early warning.
Questions worth asking with migration data: What percentage of Champions stayed in Champion over the last 30 days? Are more users moving from Loyal to At-Risk than from Loyal to Champion? Is the Can't Lose segment growing as a share of total users?
When you see accelerating drift from Loyal to At-Risk, that is a product experience signal, not just a marketing signal. Something in the product is failing to sustain engagement for your most reliable users, and the migration data surfaces it before the aggregate retention numbers catch up.
RFM in CleverTap: Building and Maintaining the Model
CleverTap has native RFM support. Navigate to the Segment tab and select RFM Analysis. Set your primary event and date range. For most apps, start with the core action event rather than app open, and set a 30 to 90-day window depending on your usage cadence.
CleverTap's RFM model automatically produces segment outputs and generates campaign strategy recommendations per segment. You can click directly from the RFM grid into the segmentation engine and create a targeted campaign without leaving the view.
For the Monetary dimension in non-transactional apps: if you have mapped a proxy signal to a custom event attribute, configure CleverTap to use that attribute as the Monetary input rather than defaulting to transaction revenue. If no proxy is configured, the model runs as an RF analysis, which is still useful but incomplete.
CleverTap also surfaces channel-specific reachability metrics per segment: what percentage of your At-Risk users have push notifications enabled, what percentage are reachable by email, and so on. An At-Risk reactivation campaign optimized purely for push that only reaches 30% of the segment is weaker than a cross-channel sequence. Build the channel mix per segment, not just the message content.
On refresh cadence: RFM scores stale quickly. Weekly refreshes for high-velocity consumer apps. Bi-weekly for slower cadence products. CleverTap's live segments update in real time as users match criteria, which removes the manual refresh problem when combined with journey automations: a user who drops from Champion to At-Risk can trigger an intervention campaign automatically.
The Limitation RFM Cannot Fix
RFM tells you what happened. It does not tell you why.
A user with a declining Recency score could have stopped using your app because a competing product took their attention, a specific feature they relied on broke or was removed, their life circumstances changed, they encountered a UX problem they could not resolve, or they achieved their goal and had no reason to return.
RFM scores these users identically. Your intervention strategy for each scenario should be completely different.
This is the structural limitation of any backward-looking behavioral model. It surfaces the pattern. You have to diagnose the cause. Without understanding why At-Risk users are drifting, reactivation campaigns risk sending the wrong message to users who left for reasons no campaign can address.
What to Layer on Top of RFM
Behavioral context from event sequences
Look at what At-Risk users did in their last two or three sessions before disengaging. Did they hit a paywall? Did they complete onboarding but never activate a core feature? Did they use a flow that was recently redesigned? Event sequence analysis around the point of disengagement surfaces the cause that RFM labeling alone cannot.
In-app surveys at re-engagement moments
For Can't Lose and At-Risk segments, a single-question survey shown at a re-engagement moment recovers the "why" that no behavioral model produces on its own. "What brought you back?" asked of a re-engaged At-Risk user generates diagnostic signal that shapes every subsequent campaign in that segment. Digia Engage's survey product runs inside the app at high-signal moments, with response rates significantly higher than email surveys.
Predictive churn scoring
RFM gives you a current snapshot. Churn probability scoring gives you a forward estimate. CleverTap's Clever.AI lets you define goals and predict each user's likelihood of achieving or failing to achieve them. Combining RFM segment labels with churn probability creates a priority matrix: a user who is both At-Risk by RFM score and high-probability-to-churn by the predictive model is your highest-urgency intervention target. Act on both signals together rather than either in isolation.
Cohort overlays
RFM segments cut across all users regardless of when they joined. Overlaying acquisition cohort data on top of RFM segments reveals whether your newest cohorts are progressing toward Champion status at the same rate as older cohorts did. A deteriorating cohort trajectory explains growing At-Risk and Can't Lose populations that RFM labels but cannot diagnose.
Common Mistakes Teams Make with RFM
Using app open as the recency event when a more meaningful event exists. App open captures presence, not engagement. For most apps, a completed core action is a better recency anchor.
Setting thresholds based on calendar convention rather than behavioral data. "30 days" feels natural but may be wrong for your product's usage cycle. Calibrate against your actual engagement distribution.
Treating Dormant users as a reactivation priority. Budget and attention directed at low-probability Dormant recovery is almost always better spent on preventing At-Risk users from sliding further.
Running RFM once and treating it as stable. User behavior shifts continuously. A static run from last quarter tells you about last quarter.
Skipping the monetary translation step. Running RFM with all Monetary values at zero collapses the model to an RF analysis. That is not useless, but it loses a full dimension of differentiation.
Over-segmenting. Fifteen micro-segments produce operational overhead that teams cannot sustain. Five to seven segments is the working maximum for most mobile growth teams.
Key Takeaways
RFM works in mobile because behavior is the right input. It ranks users by what they do, self-corrects as behavior changes, and requires no external data.
The translation step is not optional. Recency and Frequency map to your core engagement events. Monetary requires a proxy signal for non-transactional apps, and the proxy must reflect actual value generated, not just activity volume.
The five segments that drive strategy are Champions, Loyal Users, At-Risk, Can't Lose, and Dormant. Each requires a distinct campaign approach, channel mix, and realistic expectation of recovery rate.
Migration data is more valuable than static segment labels. Tracking movement between segments over time surfaces product experience problems that aggregate retention metrics will not catch until later.
RFM tells you what happened. To understand why, layer in event sequence analysis, in-app surveys, predictive churn scoring, and cohort data.
CleverTap's native RFM implementation automates the scoring and segment creation. Configure your Monetary input explicitly for non-transactional apps. Set a refresh cadence that matches your product's velocity. Use live segments and journey automations so interventions fire in real time, not from a manual campaign queue.
Further Reading
From Digia Engage:
Segmentation in Analytics: Why Averages Hide What Matters covers why aggregate metrics mask the behavioral variation that RFM is designed to surface.
Cohort Analysis for Mobile Apps: Seeing Patterns Most Teams Miss is the natural complement to RFM: cohort analysis shows how different acquisition groups progress over time; RFM shows where they are in the relationship today.
Mobile Growth Metrics Explained: CAC, LTV, ARPU, and Their Limitations covers why aggregate growth metrics are lagging indicators, and how RFM provides the leading behavioral signal they lack.
Retention Curves: The Most Misunderstood Chart in Mobile gives the retention context that RFM segmentation acts on.
External Sources:
RFM Analysis: CleverTap's Implementation Guide covers the technical setup for CleverTap's native RFM model.
RFM Segmentation Framework, Umbrex is a practitioner-level reference on the full RFM methodology including modern adaptations for subscription and usage contexts.
RFM Analysis Guide, HubSpot covers scoring methodology and threshold calibration in detail.
RFM Segmentation 2026: The Ecommerce Customer Framework, Digital Applied makes the case for where the asymmetric ROI in RFM sits, specifically in the Can't Lose segment.
RFM-LIR Feature Framework for Churn Prediction in Mobile Games covers RFM extensions relevant for gaming apps, adding Lifetime, Intensity, and Reward dimensions.
Digia Engage helps mobile growth teams act on RFM segments directly inside the app. In-app nudges, gamification mechanics, surveys, and personalized widgets can be triggered by CleverTap RFM segment data without an engineering release. See how the integration works.
