
A mobile team ships a feature after weeks of planning, design, and development. The release goes smoothly, dashboards update, and early signals look stable. Retention hasn’t dropped significantly, engagement appears consistent, and overall metrics suggest nothing is wrong. From a distance, the system looks healthy.
But averages are designed to smooth reality, not reveal it. Beneath stable numbers, user behavior is often shifting in ways that aggregated metrics cannot capture. New users may be leaving faster, specific segments may be disengaging, and recent changes may be impacting only a subset of users.
“Averages don’t lie, but they don’t tell the truth either.”
Cohort analysis exists to expose what averages hide. It does not replace metrics, but it changes how they are interpreted. Instead of asking what is happening overall, it asks how different groups of users behave over time.
Why Most Mobile Metrics Fail to Explain User Behavior
Most mobile analytics systems are built for visibility rather than explanation. They track daily active users, session durations, conversion rates, and funnel completions. These metrics are useful for monitoring performance, but they rarely explain why something changed or where the change originated.
When a metric drops or improves, teams often react without clarity. They investigate recent releases, marketing campaigns, or external factors, but struggle to isolate the root cause. This is because aggregated metrics collapse multiple user journeys into a single number, removing the context needed for diagnosis.
The limitation is structural. Metrics answer what happened, but not to whom, when, or under what conditions. Without that context, decision-making becomes reactive and often misleading.
What Cohort Analysis Actually Means (And Why It Matters)
Cohort analysis introduces structure into this ambiguity by grouping users based on shared characteristics and tracking their behavior across time. Instead of viewing users as a single population, it breaks them into meaningful segments that can be observed independently.
A cohort is not just a segment; it is a segment with a timeline. This distinction is critical because user behavior evolves. The way a user interacts with an app on day one is very different from how they behave after a week or a month.
Cohort analysis enables teams to ask questions that aggregated metrics cannot answer:
- How do users acquired last week behave compared to those acquired a month ago?
- Do users who complete onboarding retain better than those who skip it?
- Did a recent feature improve long-term engagement or just initial activity?
These questions shift analytics from reporting to understanding.
Averages vs Cohorts: The Gap Between Visibility and Understanding
Averages provide clarity at a surface level, but they obscure variability. Cohorts introduce complexity, but that complexity reflects reality. The difference between the two is not just analytical; it is philosophical.
| Metric Type | What It Shows | What It Misses |
|---|---|---|
| Averages | Overall performance snapshot | Differences across user segments |
| Aggregated Metrics | Current state of the system | Behavioral evolution over time |
| Cohort Analysis | Segment-level behavior across time | Requires interpretation effort |
An average retention rate of 25 percent can represent very different underlying dynamics. It could indicate consistent retention across all cohorts, or it could mask a decline in newer cohorts while older ones remain stable. Without cohort analysis, both scenarios look identical.
This is where many teams misinterpret stability as success. In reality, the system may already be degrading.
Types of Cohorts You Should Be Using
Time-Based Cohorts: Measuring Retention Over Time
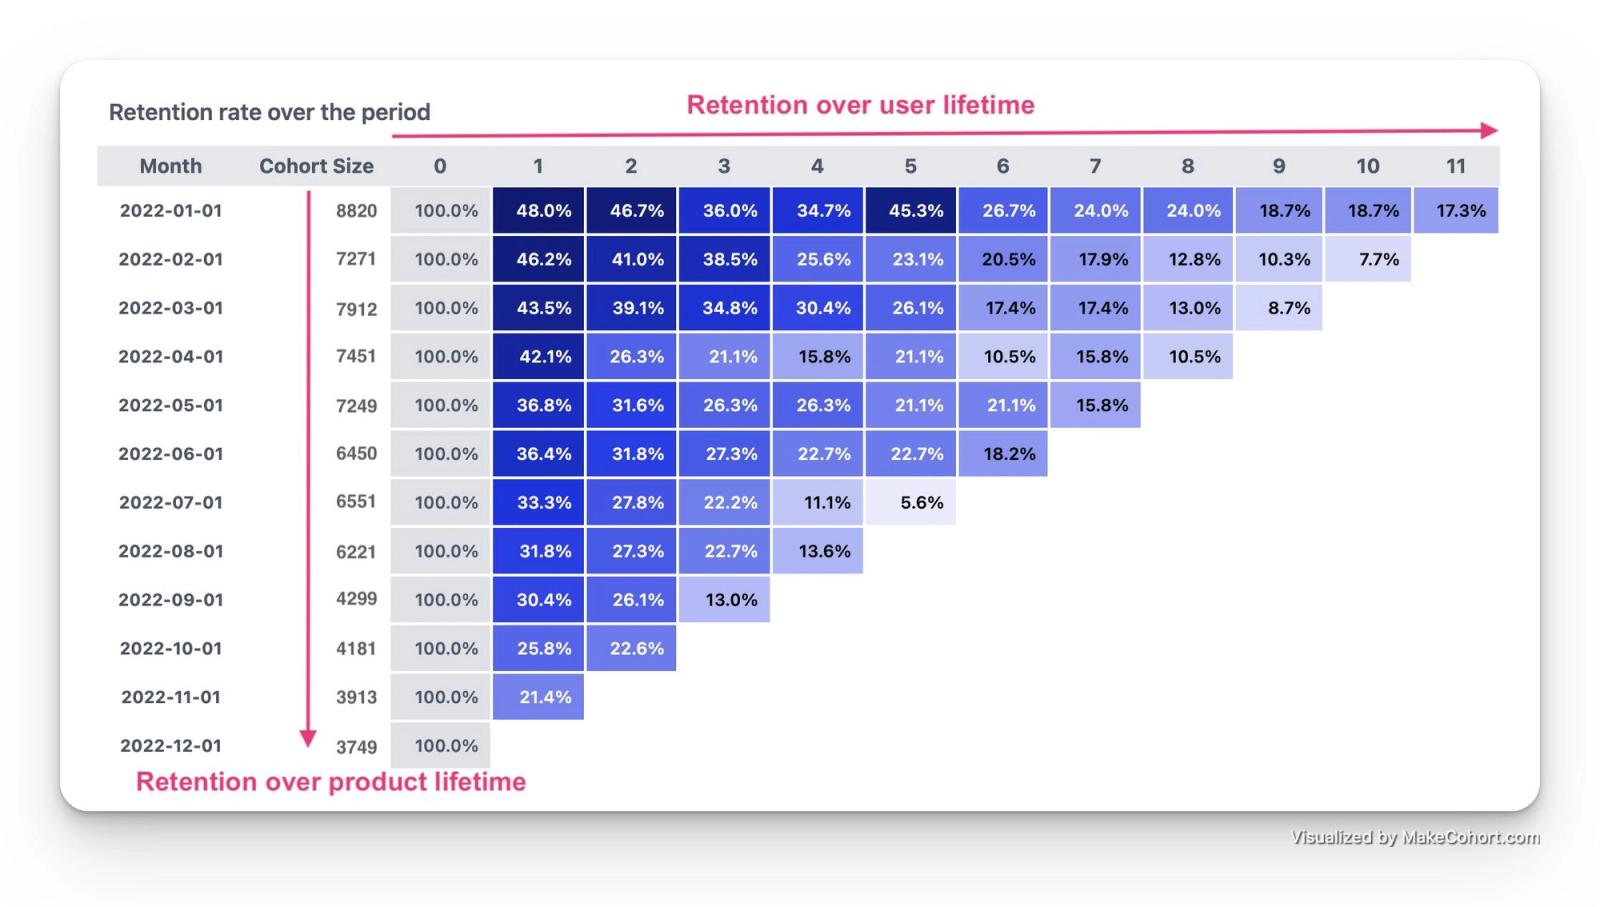
Time-based cohorts group users based on when they first interacted with the product, typically by install date or signup date. These cohorts are fundamental because they allow teams to measure retention in a structured and comparable way.
By observing how different cohorts behave over days or weeks, teams can identify whether the product experience is improving or deteriorating. A gradual decline in newer cohorts often signals onboarding issues or misaligned expectations created during acquisition.
Without time-based cohorts, retention becomes a static number. With them, it becomes a story of how the product evolves.
Behavior-Based Cohorts: Understanding User Intent
Not all users arrive with the same intent, and not all of them engage with the product in meaningful ways. Behavior-based cohorts group users according to actions they take, such as completing onboarding, using a core feature, or reaching a key milestone.
This type of cohort analysis helps differentiate between passive users and those who experience actual value. Users who engage deeply early on tend to exhibit stronger retention patterns, while those who do not often churn quickly.
Behavior-based segmentation introduces an important shift. It moves analysis away from who users are and toward what they do.
Acquisition-Based Cohorts: Measuring Growth Quality
Growth metrics often prioritize volume, but not all growth is equal. Acquisition-based cohorts group users by their source, allowing teams to evaluate the quality of different channels.
This type of analysis helps answer questions such as whether paid campaigns are bringing in high-value users or whether organic channels produce more sustainable engagement. It also highlights mismatches between marketing promises and product experience.
- Organic users often show stronger long-term retention
- Paid users may drive short-term spikes but weaker engagement
- Referral users tend to align closely with product value
Understanding these differences is essential for aligning growth with retention.
Reading Cohorts the Right Way
How to Identify Healthy vs Unhealthy Cohorts
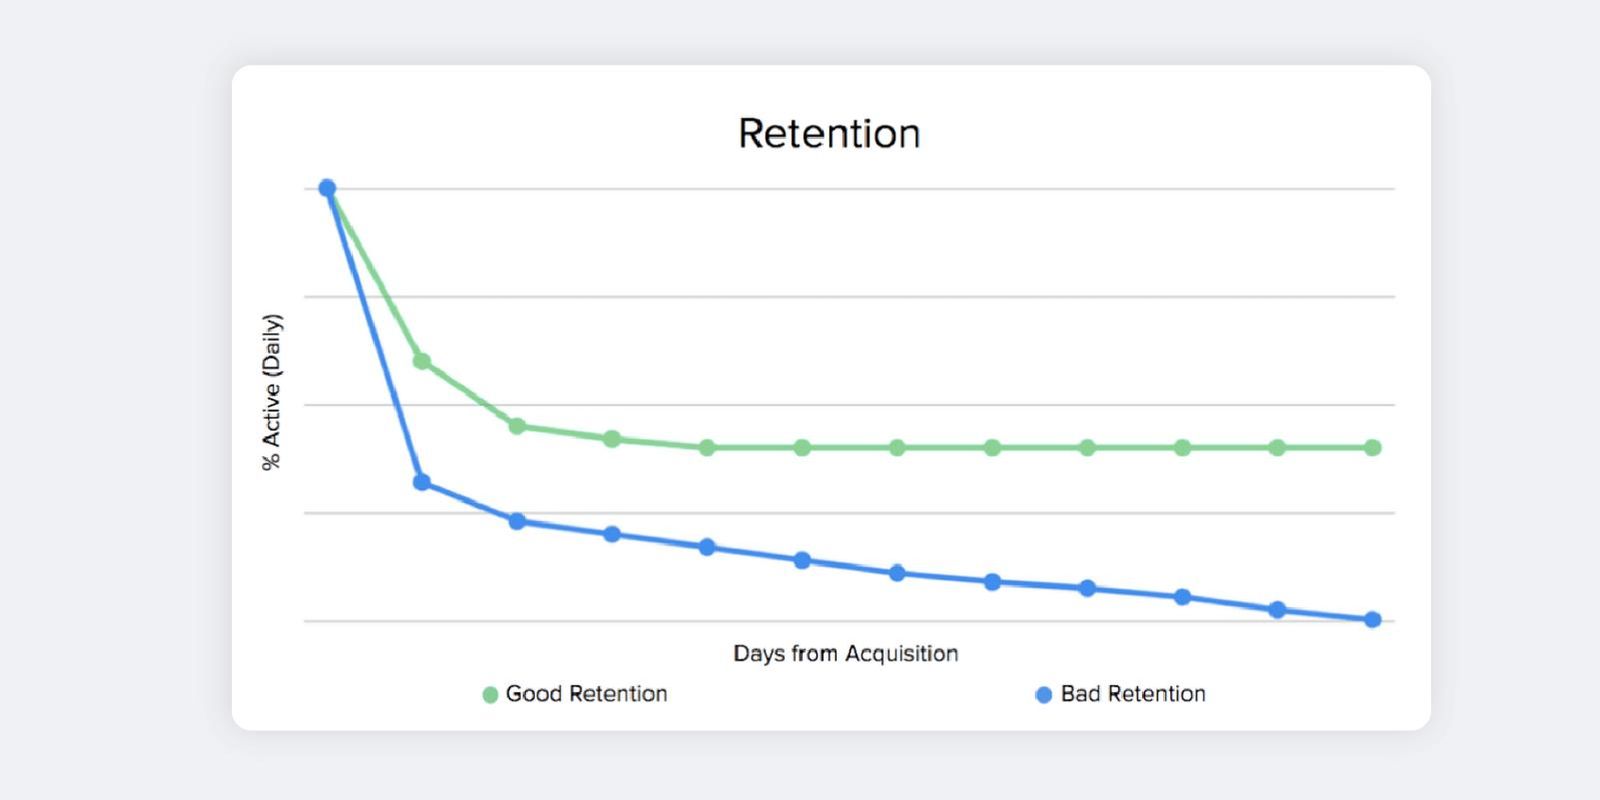
Cohort analysis is not just about numbers; it is about patterns. A healthy cohort typically shows a sharp initial drop followed by stabilization, indicating that a core group of users continues to find value.
| Cohort Shape | What It Indicates |
|---|---|
| Sharp drop, then plateau | Stable product value for a core segment |
| Continuous decline | Weak retention and poor product fit |
| Sudden drop at a specific point | Potential feature or experience issue |
The shape of the retention curve often matters more than the exact percentages. Patterns reveal structure, while numbers alone can mislead.
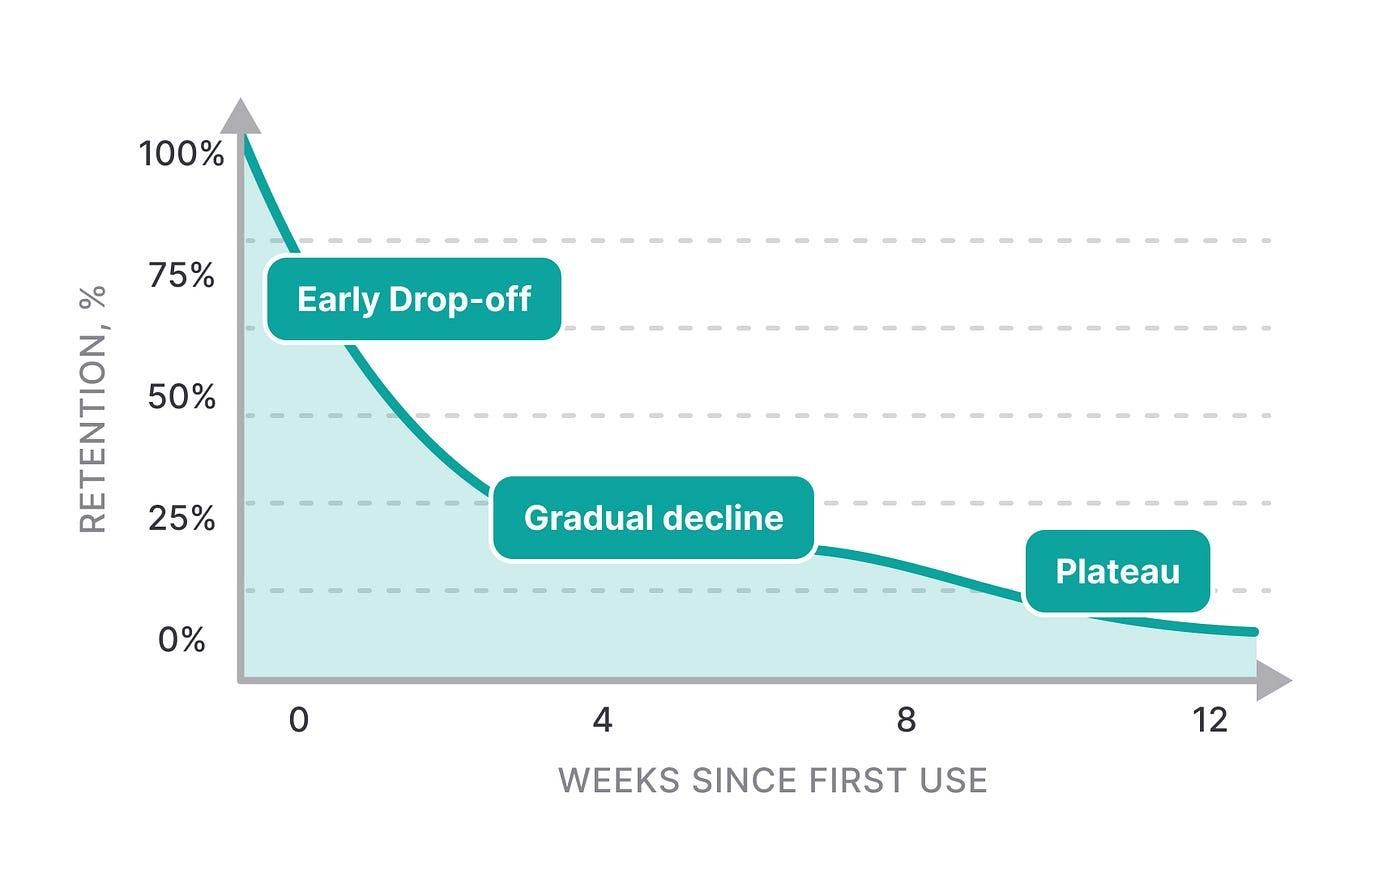
What Retention Curves Reveal That Dashboards Don’t
Retention curves provide a visual representation of how user engagement changes over time. Unlike dashboards that present static metrics, curves reveal the dynamics of user behavior.
They help identify specific moments where users disengage, whether during onboarding, after a feature interaction, or at later stages of the lifecycle. These inflection points often correspond to friction, confusion, or unmet expectations.
By focusing on these transitions, teams can identify actionable opportunities for improvement.
Early Signals vs Long-Term Patterns
Early retention metrics reflect the effectiveness of onboarding and initial user experience. Long-term retention, on the other hand, reflects the sustained value of the product.
Teams often prioritize early metrics because they are easier to influence and quicker to measure. However, improvements in early retention do not always translate into long-term engagement.
Cohort analysis allows both to be evaluated independently, preventing short-term optimizations from masking deeper issues.
Cohorts and Product Decisions
Measuring the Impact of Feature Releases
Feature releases rarely affect all users equally, and aggregated metrics often fail to capture their true impact. Cohort analysis allows teams to isolate users who were exposed to a feature and compare their behavior against those who were not.
This makes it possible to evaluate whether a feature genuinely improves retention or simply increases short-term activity. It also helps identify unintended consequences that may affect specific segments.
Detecting Silent Failures
Not all failures are visible. Some features degrade user experience gradually, affecting only certain cohorts without causing immediate drops in overall metrics.
These silent failures are particularly dangerous because they remain undetected until their impact accumulates. Cohort analysis reveals these patterns by highlighting divergence between groups.
When one cohort begins to underperform relative to others, it often signals an issue that requires investigation.
Separating Correlation from Real Impact
Metrics often change for multiple reasons simultaneously, making it difficult to attribute improvements to specific actions. Cohort analysis introduces a level of control by enabling comparisons across time and segments.
By observing whether changes are consistent across cohorts, teams can distinguish between genuine improvements and coincidental trends. This reduces the risk of making decisions based on misleading signals.
Growth vs Retention Cohorts: Two Different Stories
Why Growth Metrics Can Be Misleading
Growth metrics are inherently biased toward new users, who tend to be more active in their initial interactions. This creates an illusion of improvement, as fresh cohorts temporarily boost engagement.
However, this effect fades quickly, and without retention analysis, teams may overestimate the impact of growth initiatives.
Retention as the True Measure of Value
Retention cohorts focus on whether users continue to find value over time. They remove the noise created by acquisition spikes and provide a clearer view of product performance.
Retention is slower to change, but it reflects the underlying health of the product more accurately than any growth metric.
Balancing Growth and Retention
Sustainable growth requires alignment between acquisition and retention. Cohort analysis helps identify which channels and features contribute to long-term value, allowing teams to prioritize efforts that strengthen both.
Without this balance, growth becomes inefficient and retention becomes unstable.
Common Mistakes in Cohort Analysis
Many teams implement cohort analysis but fail to use it effectively. Common mistakes include focusing only on early retention, ignoring behavior-based segmentation, and treating cohort data as static reports rather than diagnostic tools.
Another frequent issue is the lack of clear questions. Cohort analysis is most valuable when it is used to investigate specific hypotheses rather than passively observed.
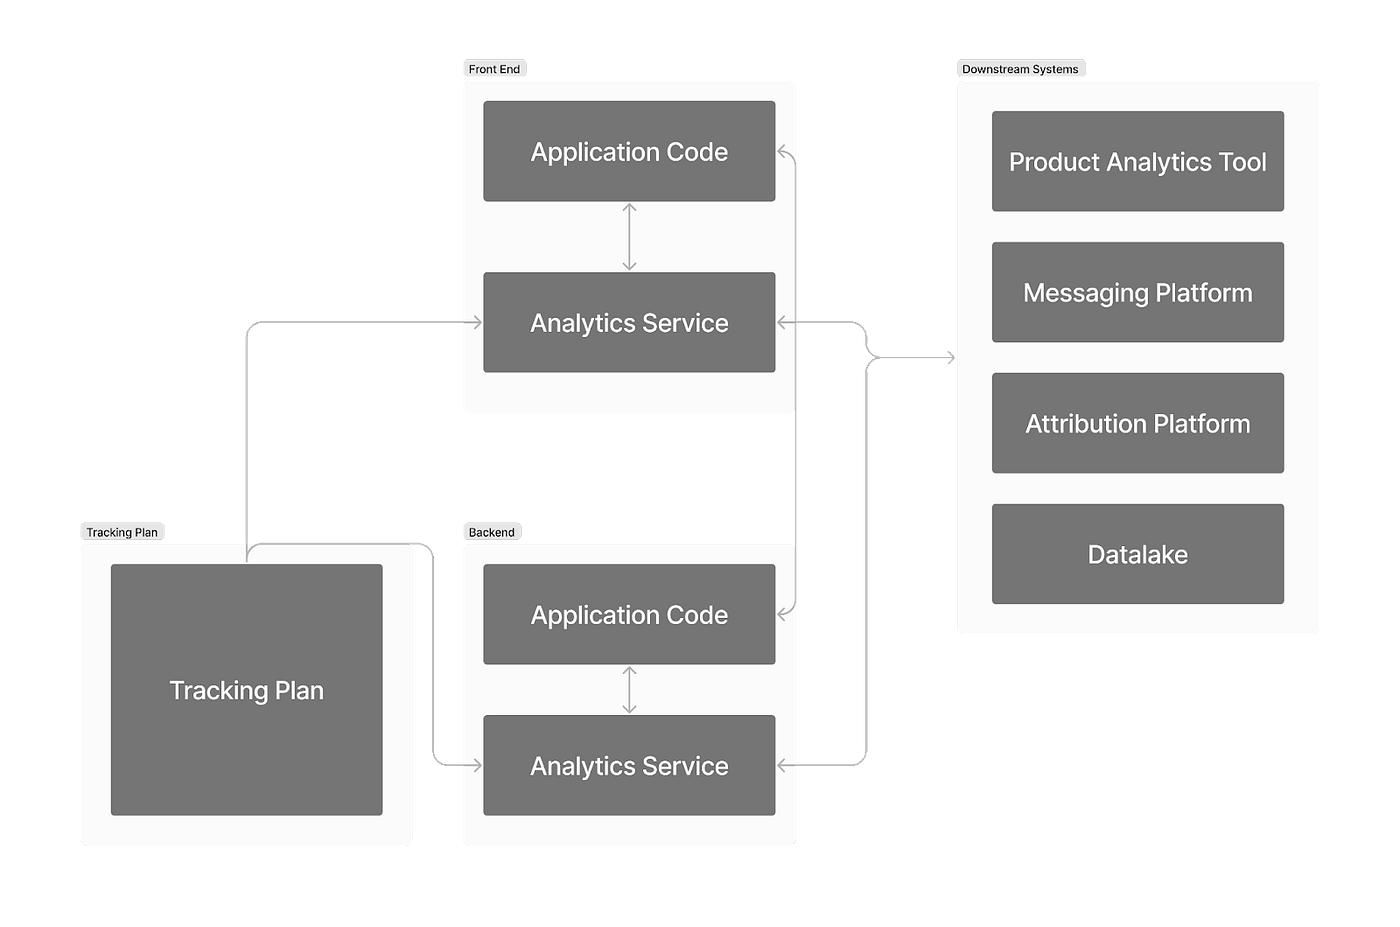
How to Build a Cohort-Driven Analytics System
A cohort-driven system begins with clarity about what defines value within the product. This includes identifying key actions that represent meaningful engagement and ensuring they are consistently tracked.
It also requires structuring data in a way that allows cohorts to be easily created and compared. This involves defining time intervals, maintaining clean event data, and aligning analytics with product decision-making processes.
“The goal of analytics is not to collect data, but to understand behavior.”
When cohort insights are integrated into product workflows, they become a tool for continuous improvement rather than retrospective analysis.
Conclusion: Stop Looking at Averages, Start Seeing Behavior
Averages simplify complexity, but they do so by removing the very details that matter. Cohorts reintroduce that complexity, making it possible to see how different users experience the product over time.
This shift is not just analytical; it is strategic. It changes how teams interpret data, prioritize decisions, and evaluate success.
Understanding a mobile app is not about knowing what most users do. It is about understanding how different users behave, why they behave that way, and how that behavior changes.
That is where real insight lives.