
In most mobile organizations, growth is framed as a system that can be measured with precision. Users are acquired through defined channels, costs are tracked at the campaign level, and revenue is observed across time. This creates the impression that growth is controllable, as if adjusting inputs will reliably influence outcomes.
Within this structure, mobile growth metrics like CAC, LTV, and ARPU become the primary tools for understanding performance. They provide a standardized way to evaluate acquisition efficiency, user value, and monetization. When these metrics improve, growth appears healthy. When they decline, teams assume something is broken.
The limitation is structural. These metrics measure outcomes after user behavior has already taken place. They do not explain the sequence of user decisions - activation, engagement, retention - that produced those outcomes. This gap is where most growth misinterpretation begins.
What Are Mobile Growth Metrics?
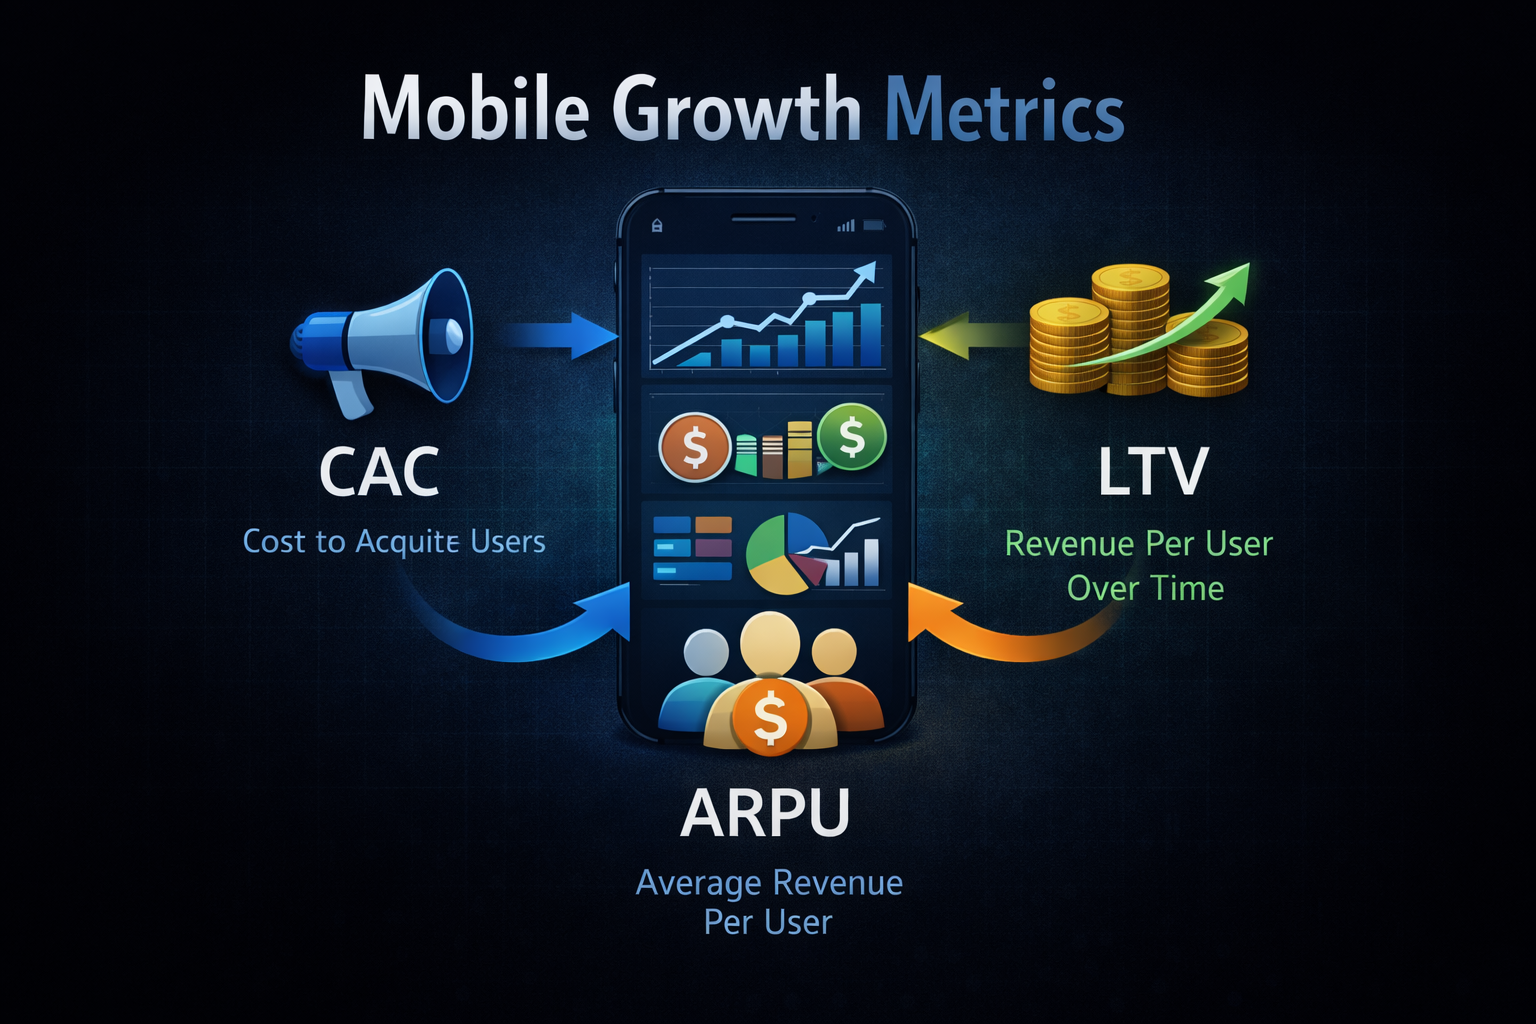
Mobile growth metrics are quantitative measures used to evaluate how efficiently a mobile app acquires users, monetizes them, and retains value over time. The three most commonly used metrics are:
- Customer Acquisition Cost (CAC): the cost required to acquire a user
- Lifetime Value (LTV): the total revenue generated by a user over time
- Average Revenue Per User (ARPU): the average revenue generated per user
These metrics are widely used in mobile app analytics, product analytics, and growth strategy because they provide a high-level view of business performance. However, they are often misunderstood as decision-making tools rather than outcome indicators.
The Standard Growth Model - And Its Hidden Gaps
The conventional growth model assumes a linear progression. Users are acquired, they generate revenue, and over time they contribute to long-term value. CAC, ARPU, and LTV map directly to these stages, creating a sense that the entire lifecycle is measurable.
This model is effective for reporting because it simplifies complexity into distinct stages. It allows marketing teams to focus on acquisition, product teams to focus on engagement, and leadership to focus on revenue outcomes.
However, this simplification removes the behavioral transitions between stages. Users do not move from acquisition to monetization automatically. They move because they experience value, build intent, and decide to continue using the product. Growth metrics do not capture these transitions, which makes them incomplete for decision-making.
Customer Acquisition Cost (CAC): Efficiency Without User Quality
Customer Acquisition Cost (CAC) measures how much a company spends to acquire a new user. It includes advertising spend, campaign costs, tools, and operational overhead, divided by the number of acquired users.
CAC is a core metric in mobile marketing analytics because it provides a clear signal of acquisition efficiency. It helps teams compare channels, optimize budgets, and evaluate campaign performance.
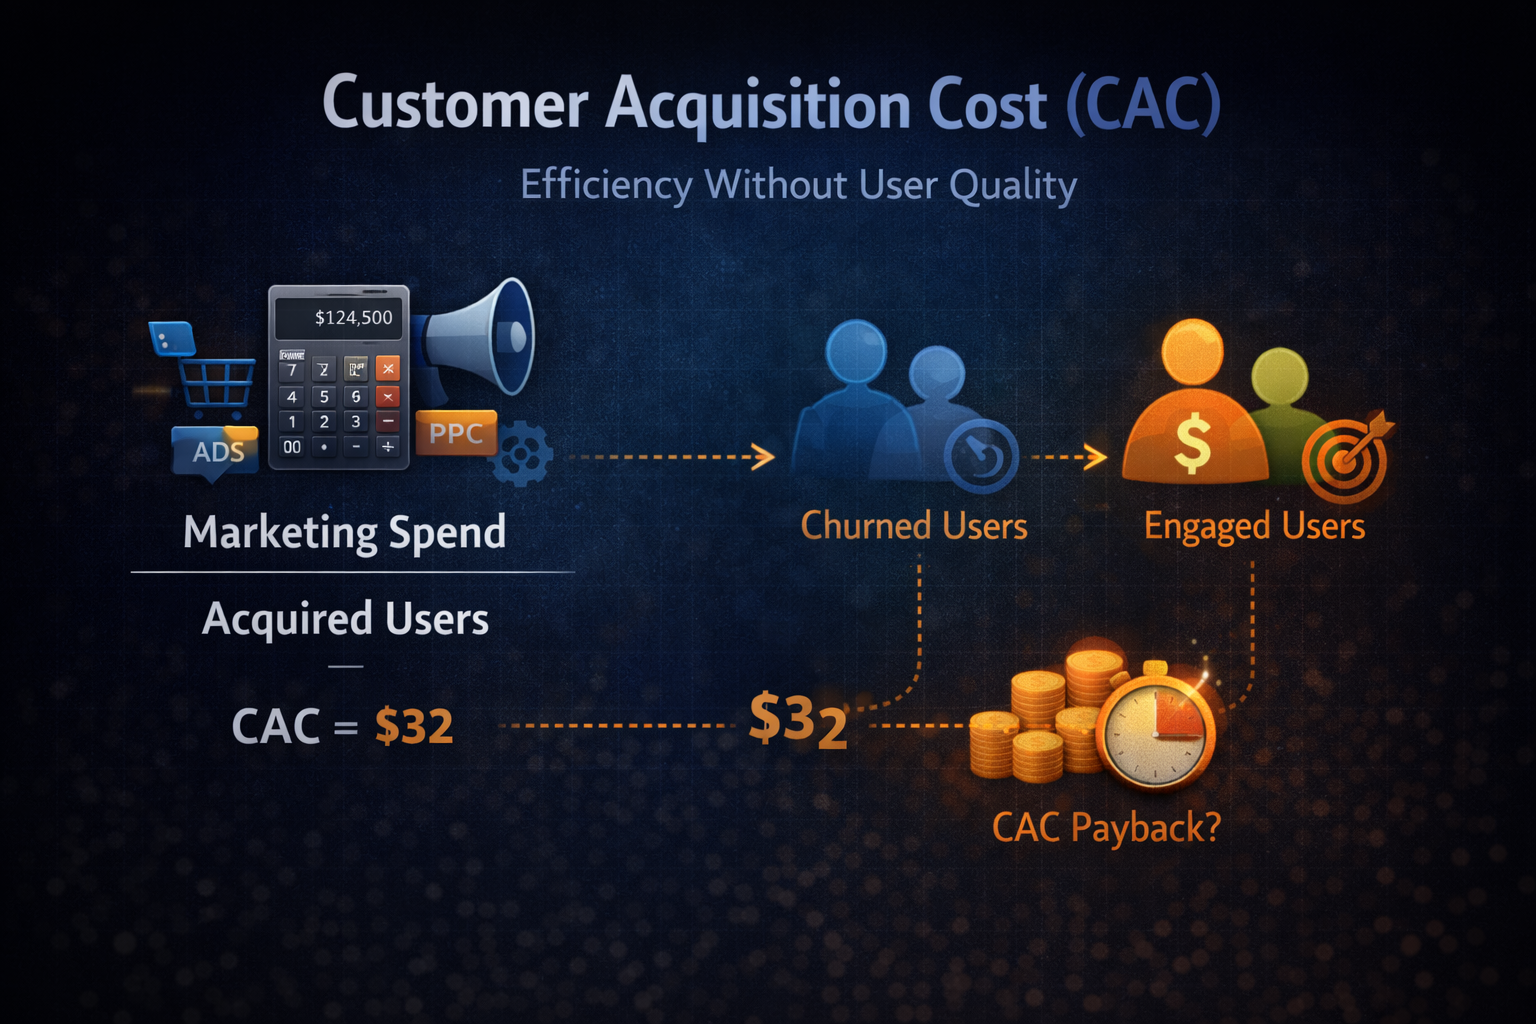
The limitation is that CAC does not measure user quality. It assumes that all acquired users contribute equally to the system, even though their behavior varies significantly after acquisition. A user who churns immediately and a user who becomes highly engaged are treated the same at the CAC level.
This becomes more complex in modern mobile ecosystems where attribution is constrained. Privacy frameworks reduce visibility into user journeys, making CAC partially dependent on modeled or aggregated data. As a result, CAC can appear precise while being behaviorally incomplete.
Another critical dimension is the CAC payback period, which measures how long it takes to recover acquisition costs through user revenue. Without considering payback, CAC can misrepresent sustainability, especially in products with delayed monetization.
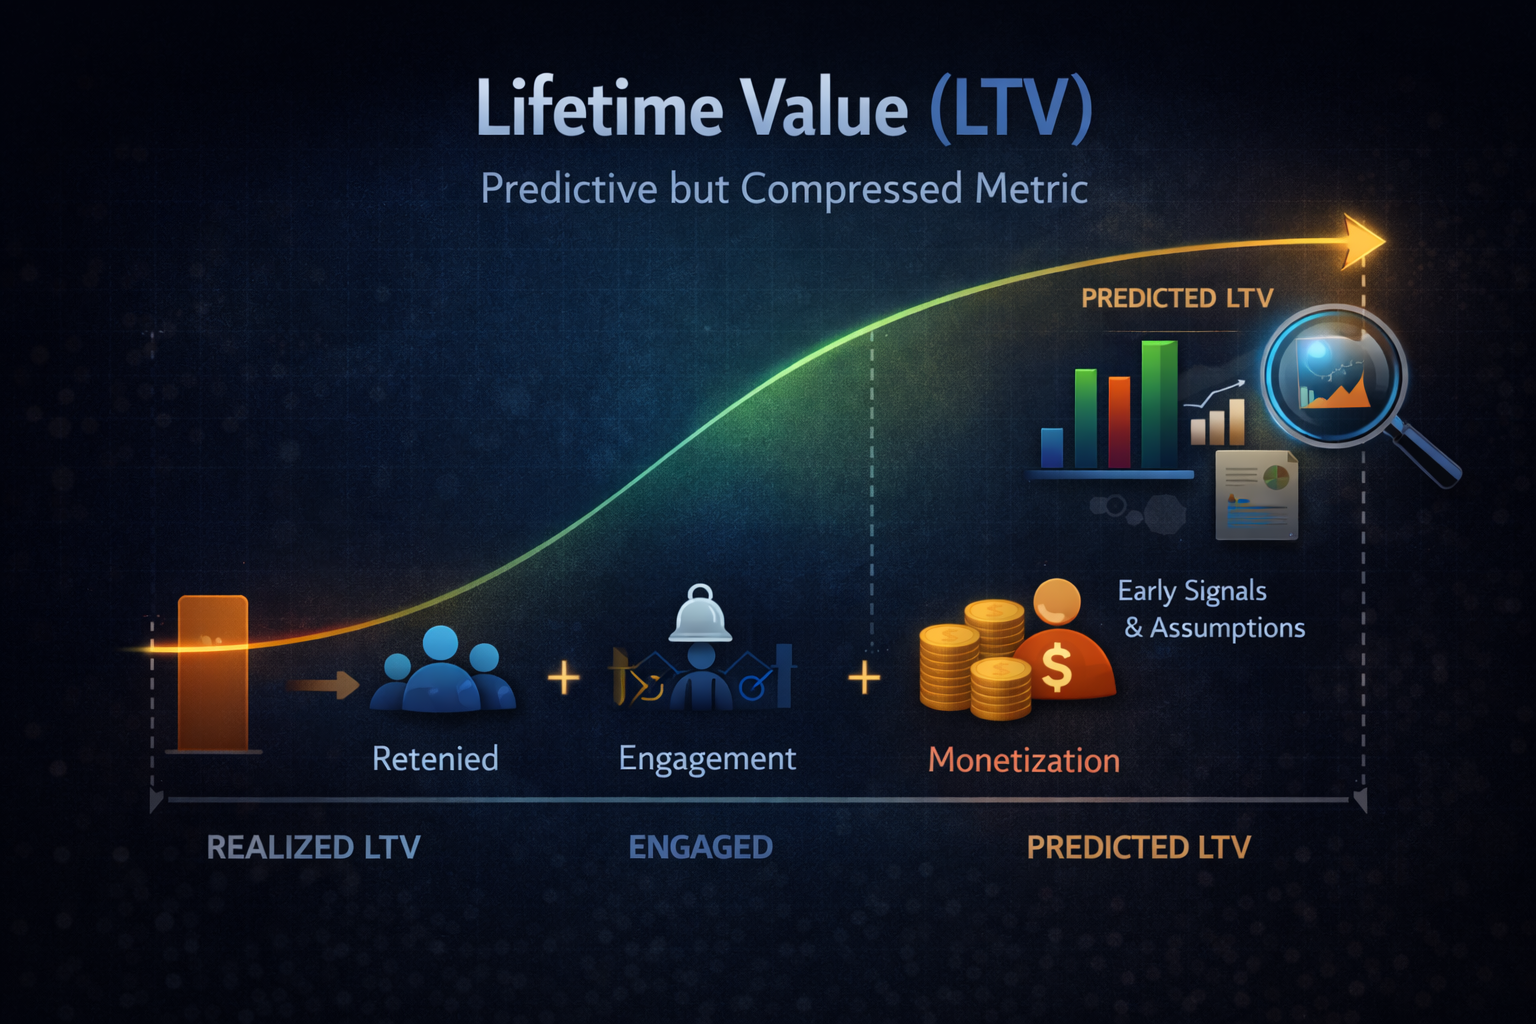
Lifetime Value (LTV): A Predictive but Compressed Metric
Lifetime Value (LTV) estimates the total revenue a user generates over their lifecycle. In mobile app analytics, LTV is often modeled using retention curves, average revenue per user, and cohort-based projections.
LTV is widely used because it connects user behavior to long-term business outcomes. It allows teams to evaluate whether acquisition is profitable and whether retention improvements translate into revenue growth.
However, LTV compresses behavioral complexity into a single number. It does not retain information about when value was created, which user actions contributed to monetization, or what caused churn.
There is also a distinction between realized LTV and predicted LTV. Realized LTV is based on actual observed data, while predicted LTV relies on early signals and assumptions. In many mobile products, especially early-stage ones, LTV is largely predictive, which introduces uncertainty into decision-making.
A more accurate interpretation of LTV is that it is the result of three interacting systems:
- Retention determines how long users stay
- Engagement defines how often they interact
- Monetization converts activity into revenue
Changes in LTV originate from these systems, not from the metric itself.
ARPU: Monetization Efficiency and Its Distortions
Average Revenue Per User (ARPU) measures total revenue divided by total users. It is commonly used in mobile monetization analytics to track revenue efficiency across time periods or segments.
ARPU is useful because it provides a stable and comparable metric. It allows teams to benchmark performance and identify trends without needing detailed behavioral data.
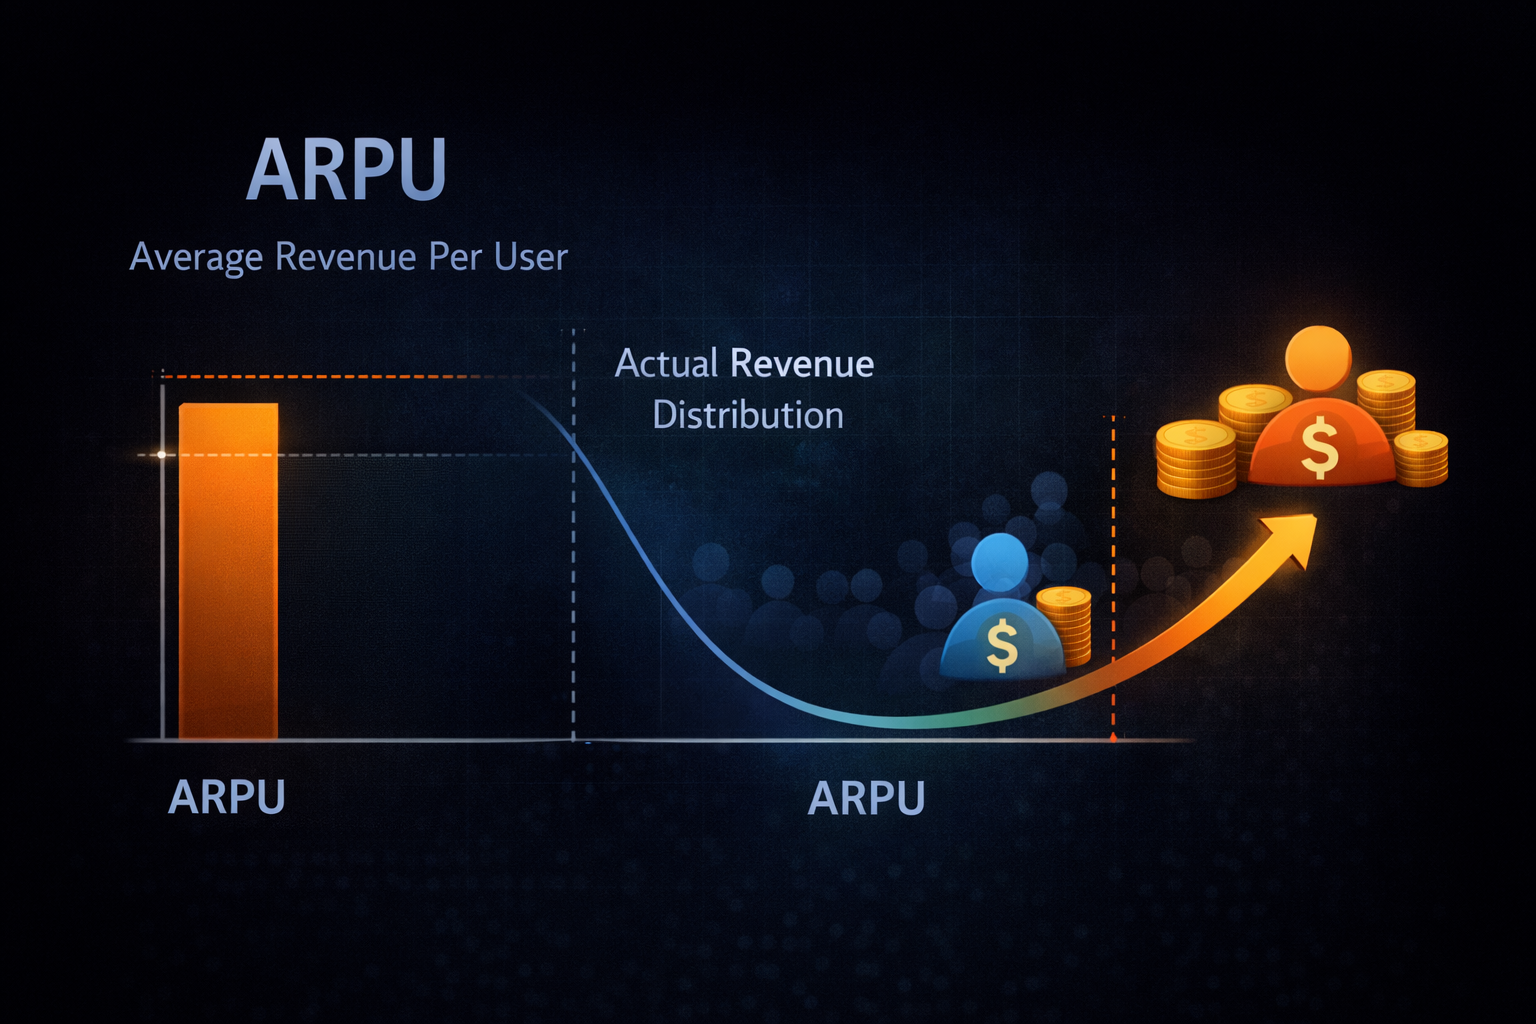
However, ARPU hides the distribution of revenue across users. In most mobile apps, revenue is not evenly distributed. A small percentage of users contributes the majority of revenue, while many users generate none.
This makes ARPU a smoothing metric. It simplifies reality but removes the variability that explains monetization behavior. Without segmentation, ARPU can mislead teams into believing that revenue growth is evenly distributed across the user base.
A Structural Comparison of CAC, LTV, and ARPU
| Metric | Measures | Strength | Limitation |
|---|---|---|---|
| CAC | Cost to acquire users | Clear acquisition efficiency | Ignores user quality |
| LTV | Total value per user | Connects revenue to lifecycle | Compresses behavior |
| ARPU | Average revenue per user | Stable monetization signal | Masks distribution |
This comparison shows that each metric serves a specific purpose, but none provides a complete understanding of growth on its own.
Why CAC, LTV, and ARPU Are Lagging Indicators
CAC, LTV, and ARPU are lagging metrics in mobile analytics. They reflect outcomes after user behavior has already occurred.
When user experience changes, behavior shifts first. Metrics respond later. This delay creates a gap between what users are experiencing and what teams observe in dashboards.
For example, a decline in onboarding quality may not immediately impact LTV, but it will affect activation and retention first. By the time LTV reflects the issue, the problem has already propagated through the system.
This lag makes it difficult to use growth metrics for real-time decision-making. They are better suited for validating outcomes than diagnosing causes.
The Risk of Optimizing Growth Metrics in Isolation
When growth metrics become targets, teams naturally optimize for them. However, because these metrics are incomplete, optimization often leads to unintended consequences.
Reducing CAC by shifting to cheaper acquisition channels can introduce low-intent users who fail to retain. Increasing ARPU through aggressive monetization can improve short-term revenue while harming long-term engagement. Optimizing LTV using historical data can mask declining performance in newer cohorts.
These patterns highlight a core issue in growth analytics for mobile apps. Metrics can improve while the underlying system deteriorates. Without behavioral context, optimization becomes disconnected from user experience.
The Missing Layer: Behavioral Analytics
To make CAC, LTV, and ARPU actionable, they must be connected to user behavior analytics. Growth metrics are outputs, while behavior is the system that produces those outputs.
Key behavioral signals include activation rates, retention curves, session depth, feature usage, and user segmentation. These signals explain how users interact with the product, where they find value, and where they drop off.
When growth metrics are analyzed alongside behavioral data, they become interpretable. Changes in CAC, LTV, or ARPU can be traced back to specific user actions, enabling more precise decision-making.
From Growth Metrics to Growth Systems
A more effective approach to growth treats metrics as part of a system rather than as endpoints. In this system, user behavior drives outcomes, and metrics reflect those outcomes.
Growth metrics indicate that something has changed in user behavior, but they do not explain what caused that change.
This perspective shifts analytics from reporting to learning. Teams focus on understanding user decisions first, then use metrics to validate whether improvements are working.
Additional Realities in Modern Mobile Analytics
Several factors make growth measurement more complex in today’s mobile ecosystem. Privacy changes have reduced the reliability of attribution, making CAC less deterministic. LTV estimation often relies on predictive models, especially for newer cohorts. User behavior varies significantly across channels, geographies, and segments, making aggregate metrics less reliable.
These realities require a shift from metric-centric thinking to system-level analysis. Growth can no longer be understood through isolated numbers; it must be interpreted through patterns of behavior.
Final Perspective: Growth Metrics Are Signals, Not Systems
CAC, LTV, and ARPU are essential for understanding business performance, but they are not sufficient for understanding growth. They provide visibility into outcomes without explaining the mechanisms that produce those outcomes.
Sustainable growth depends on how users experience the product, how value is delivered, and how engagement evolves over time. Metrics should reflect these processes, not replace them.
When used correctly, growth metrics become part of a feedback loop that connects user behavior to business outcomes. This transforms them from static reports into dynamic signals, enabling teams to move from measuring growth to actively building it.