


TL;DR
- Stories got adopted across mobile by imitation rather than intent, which is why most implementations are a carousel wearing a costume.
- This article is a companion piece to In-App Storytelling: How to Use Stories Format to Drive Engagement, which covers the psychology of why the format works.
- This piece covers what that earlier article does not: the technical delivery of video specifically on real Indian network conditions.
- It covers the actual drop-off curve by frame number and what it means for sequence design, and the CTA placement and pacing decisions that curve implies.
- It covers where to place entry points and the discovery tradeoff each one carries.
- It covers use cases for the format beyond marketing, and the measurement gap between watched and understood.
- It covers the server-driven shipping architecture that lets a sequence be edited after it has already launched, without an app release.
- Sourcing note: All statistics are attributed to their sources throughout, including India-specific network data and frame-level completion benchmarks drawn from large-scale Stories analytics datasets.
Most stories implementations fail for a reason that has nothing to do with execution quality. The team built a well-designed carousel, gave it a full-screen wrapper, added a progress bar, and called it a stories sequence, without asking whether the content inside actually benefits from autoplay, tap-to-advance, and a completion loop, or whether it was simply content that happened to exist and needed somewhere to go. The mechanical case for the format is real: autoplay makes consumption the default rather than an active choice, tap-to-advance removes interaction friction to near zero, full-screen focus eliminates competing visual elements, and a visible completion loop triggers a documented pull to finish what was started. None of these mechanisms activate for content that was not built with them in mind, and video specifically, the medium most stories sequences are built from, has its own delivery problems that the mechanical case says nothing about.
What the Format Does Mechanically, and Where This Article Picks Up
The full mechanical breakdown, anticipation, variable reward-adjacent completion pressure, and the specific psychological research behind each, is covered in depth in the companion piece linked above. What matters for this article is the practical consequence: those four mechanisms only produce their effect when the content is genuinely sequential, self-paced, and suited to full-screen, tap-driven consumption. A single static promotional image, however well designed, does not become sequential content by being placed inside a stories wrapper. The wrapper is not what makes the format work. The content-format fit is.
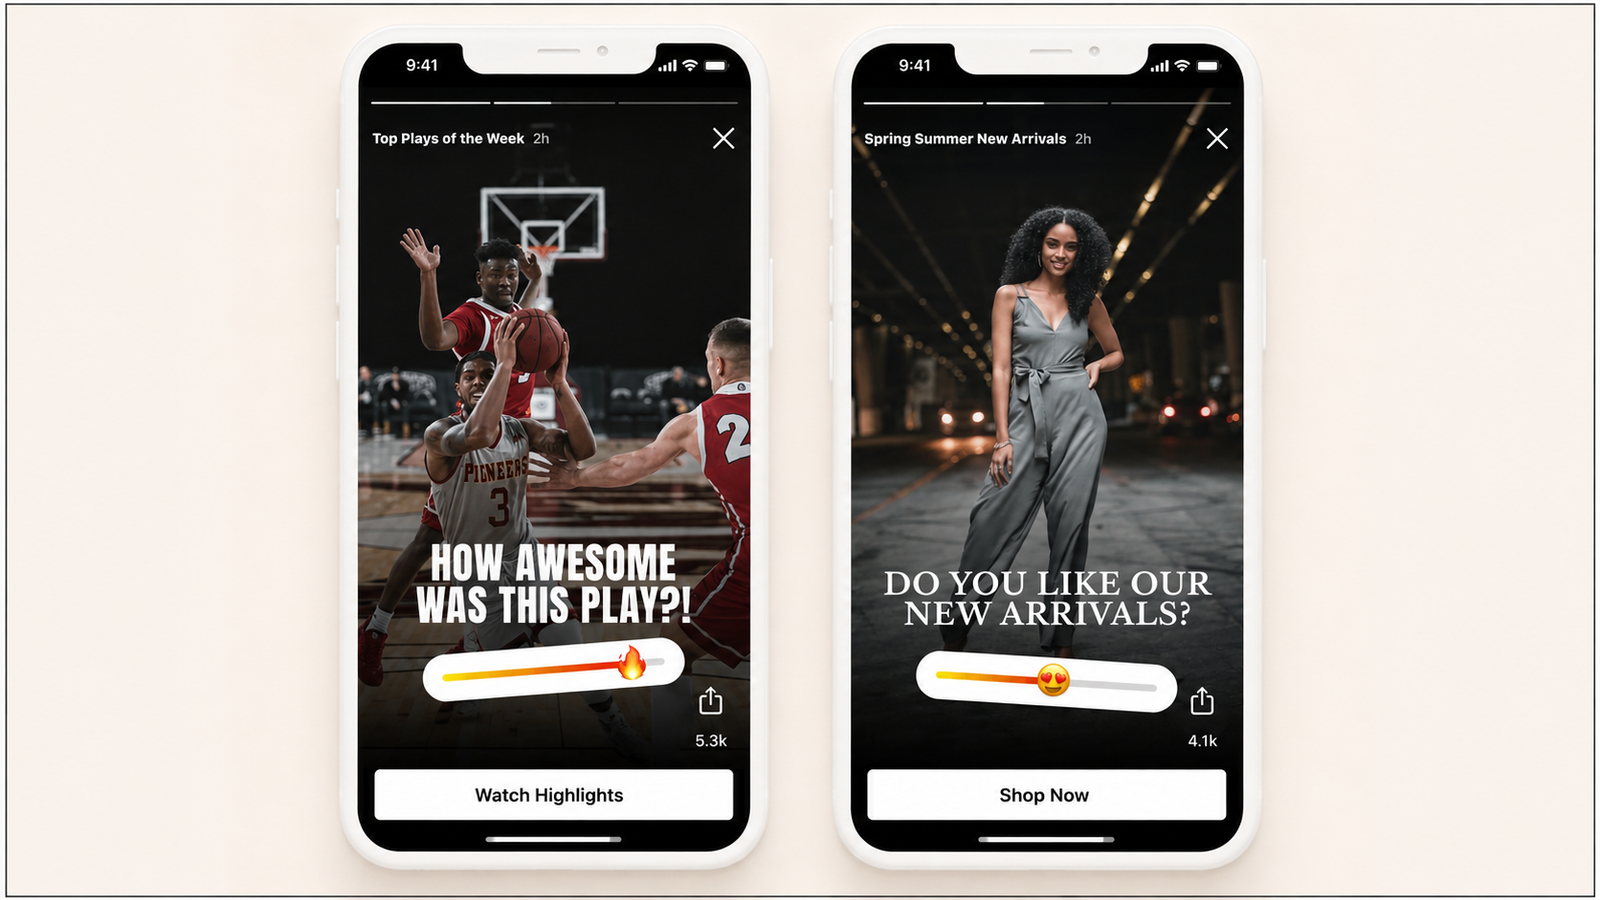
The test to apply before choosing stories over an inline surface: does the content have a natural beginning, middle, and end that benefits from being revealed progressively, and does full-screen, undivided attention genuinely improve comprehension or persuasion compared to the same content presented inline. A product discovery journey, a multi-step feature explanation, or a policy walkthrough passes this test. A single promotional message with no sequential structure does not, and forcing it into stories format produces exactly the "carousel wearing a costume" failure mode this article opened with.
Video in a Mobile App: What Actually Happens on a Real Indian Network
This is the part of the format most teams underestimate, because a video that plays flawlessly on a test device connected to office WiFi tells a team almost nothing about how it behaves on the network conditions a meaningful share of their actual users are on.
The ground reality for much of India remains a hybrid of 4G and spotty 5G, and the OpenSignal India Mobile Network Experience Report from June 2025 documents real, persistent regional variability, with rural users often experiencing latency spikes up to 150ms and median download speeds fluctuating between 2 and 15 Mbps depending on the time of day. Even with 5G reaching 45% penetration in Tier 3 towns by 2026, last-mile variability means high-bitrate streams frequently trigger rebuffering regardless of the headline network generation, and median mobile data usage per user has climbed to roughly 28GB a month, which is pushing users to be more selective about what they are willing to download or stream on cellular data, not less.
File size and codec choice. AV1 has reached a genuine tipping point by 2026, with hardware decoding now standard on mid-range Android chipsets, delivering roughly 30% better efficiency than HEVC and functioning as the practical standard for 480p mobile content. HEVC remains the more reliable middle ground for older 4G handsets specifically, providing strong detail preservation at sub-1 Mbps bitrates, while H.264 remains necessary purely for maximum device compatibility, requiring more aggressive pre-filtering to avoid visible blockiness at low bitrates. The specific target numbers worth building toward: under 700 kbps for 480p, under 1.5 Mbps for 720p, 48 kbps mono AAC audio rather than full stereo, and a VMAF perceptual quality score of 90 or higher, aiming for a file that looks identical to the source master on a 6.5-inch screen rather than simply hitting a smaller byte count.
Preloading and caching. Preloading allows portions of a video to load ahead of actual playback, reducing buffering during the moment the user is actually watching, while caching stores content locally so the same data does not need to be re-downloaded on repeat views. For a stories sequence specifically, this means the next frame in the sequence should begin preloading the moment the current frame starts playing, not when the user taps forward, since waiting until the tap to begin fetching the next frame reintroduces exactly the buffering delay the tap-to-advance mechanic is supposed to eliminate.
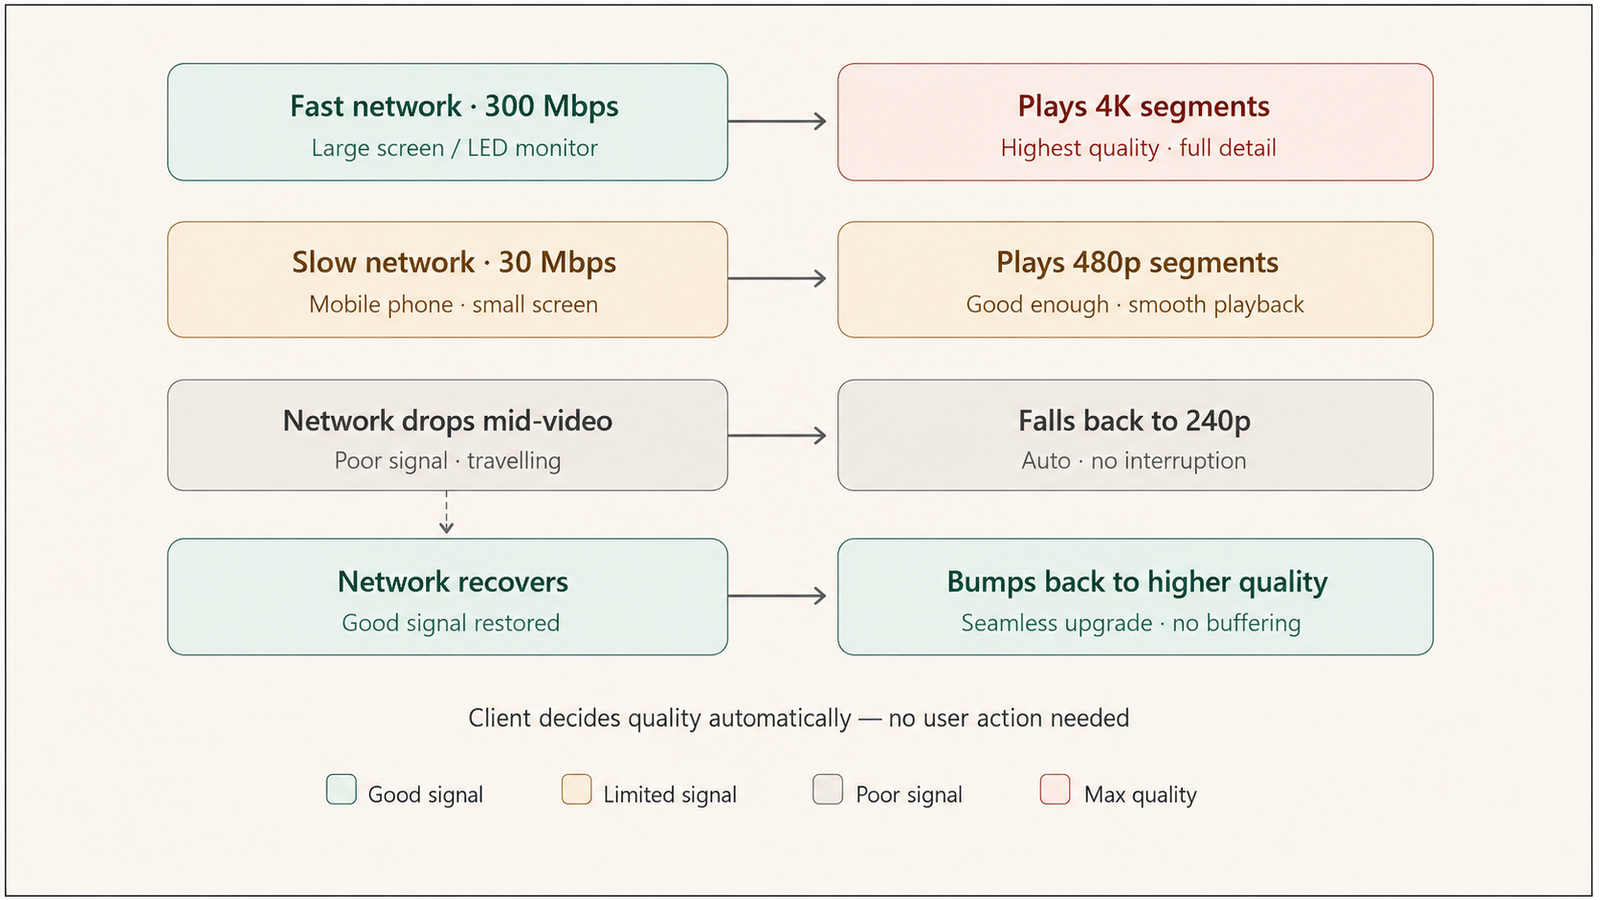
Adaptive bitrate as the correct default, not an edge-case optimisation. The correct approach is dynamic bitrate adaptation: serving a 480p version to a user on a constrained rural connection while serving 1080p to a user on stable WiFi, adjusted automatically rather than left as a fixed encode applied uniformly to every viewer. A single fixed-quality encode is a design decision that assumes a uniform network condition across the entire user base, which the OpenSignal data above confirms does not exist in the Indian market specifically.
Why this matters commercially, not just technically. Data from 2025 found that for every one-second reduction in video load time, conversion rates in Tier 2 India increased by 12%, and smaller video files were shared roughly three times more often over WhatsApp specifically in areas with expensive or limited data plans. A stories sequence that loads slowly is not simply a worse user experience in the abstract. It is a measurably worse conversion outcome, concentrated precisely in the markets where the format's reach potential is largest.
Sequence Design: Length, Pacing, and the Drop-Off Curve by Frame Number
The single most useful, and most underused, piece of data for designing a stories sequence is the actual, measured shape of the drop-off curve, because it tells a team exactly where design effort produces the most value.
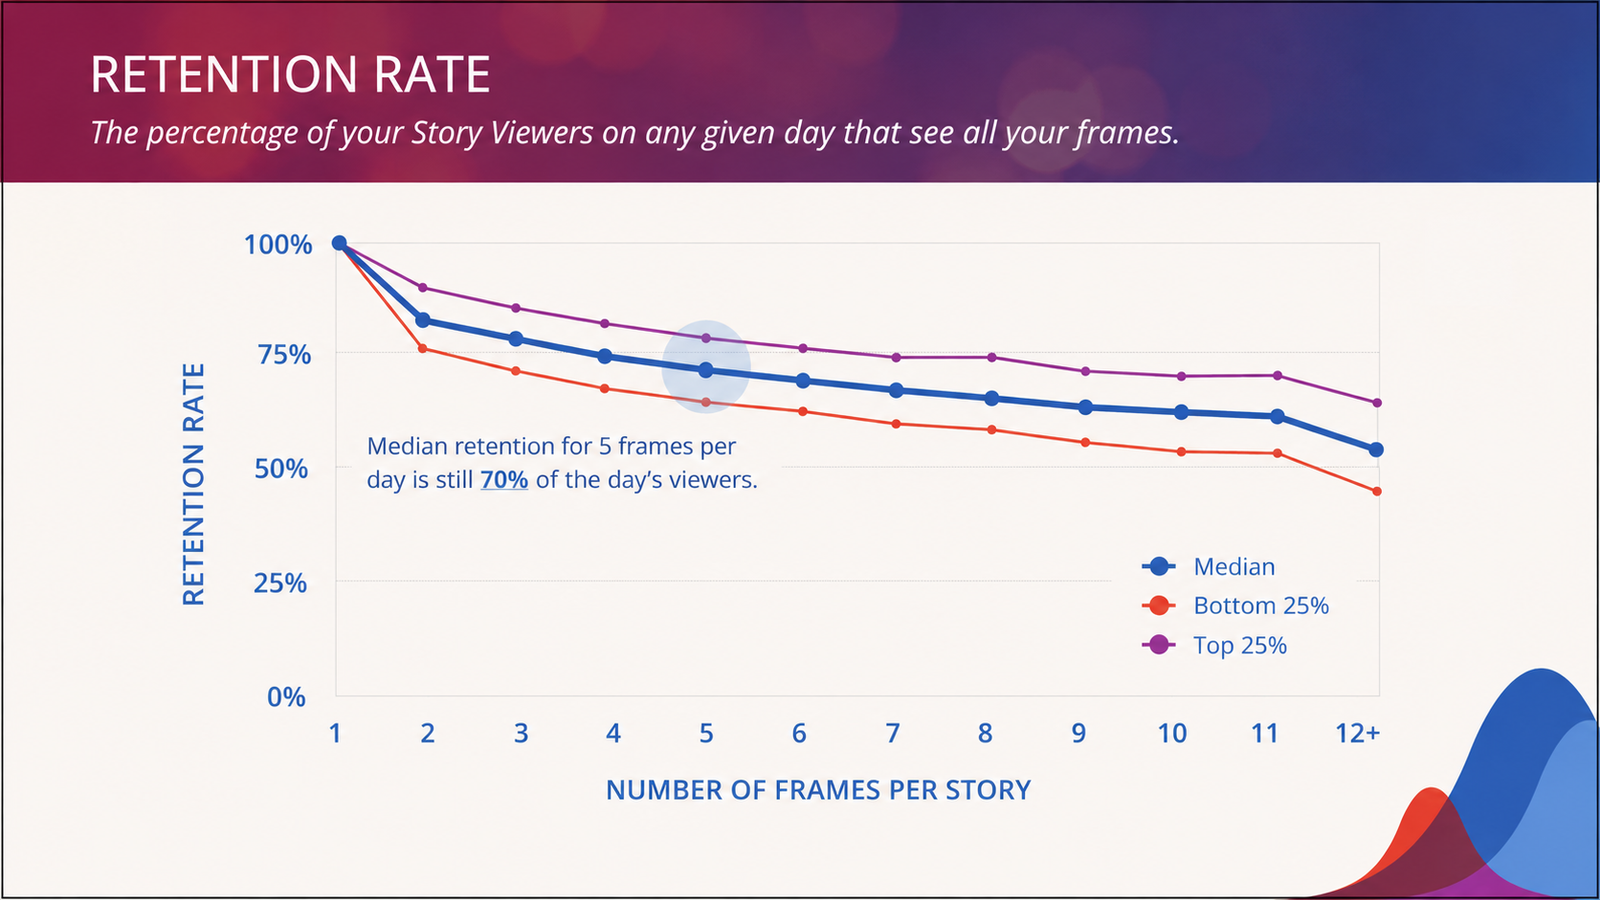
A large-scale 2025 analysis of more than 161,000 Stories found the drop-off curve has a very specific shape: the opening frame carries by far the highest exit rate, close to 24%, a number that falls steadily as viewers get deeper into a sequence, down to roughly 13% by the ninth frame. A separate compilation of the same underlying research found exit rates of 23.8% on frame one, 20.5% on frame two, and 18.5% on frame three, before settling into a steadier range of 13.3% to 15.7% across frames four through nine. The strategic implication of this specific shape is direct: the most expensive real estate in any sequence is frame one, and a viewer who survives it is measurably more likely to keep going than the raw completion percentage alone would suggest, which means design effort is disproportionately well spent on the opening frame specifically, not distributed evenly across the whole sequence.
Length. The practical target for pacing sits around 5 to 15 seconds per frame, one idea per frame, and never more frames than the specific idea genuinely earns. For sequences prioritising reach, 6 to 13 frames is the general range. For sequences where completion rate matters more than raw reach, 7 frames or fewer produces a measurably higher completion outcome.
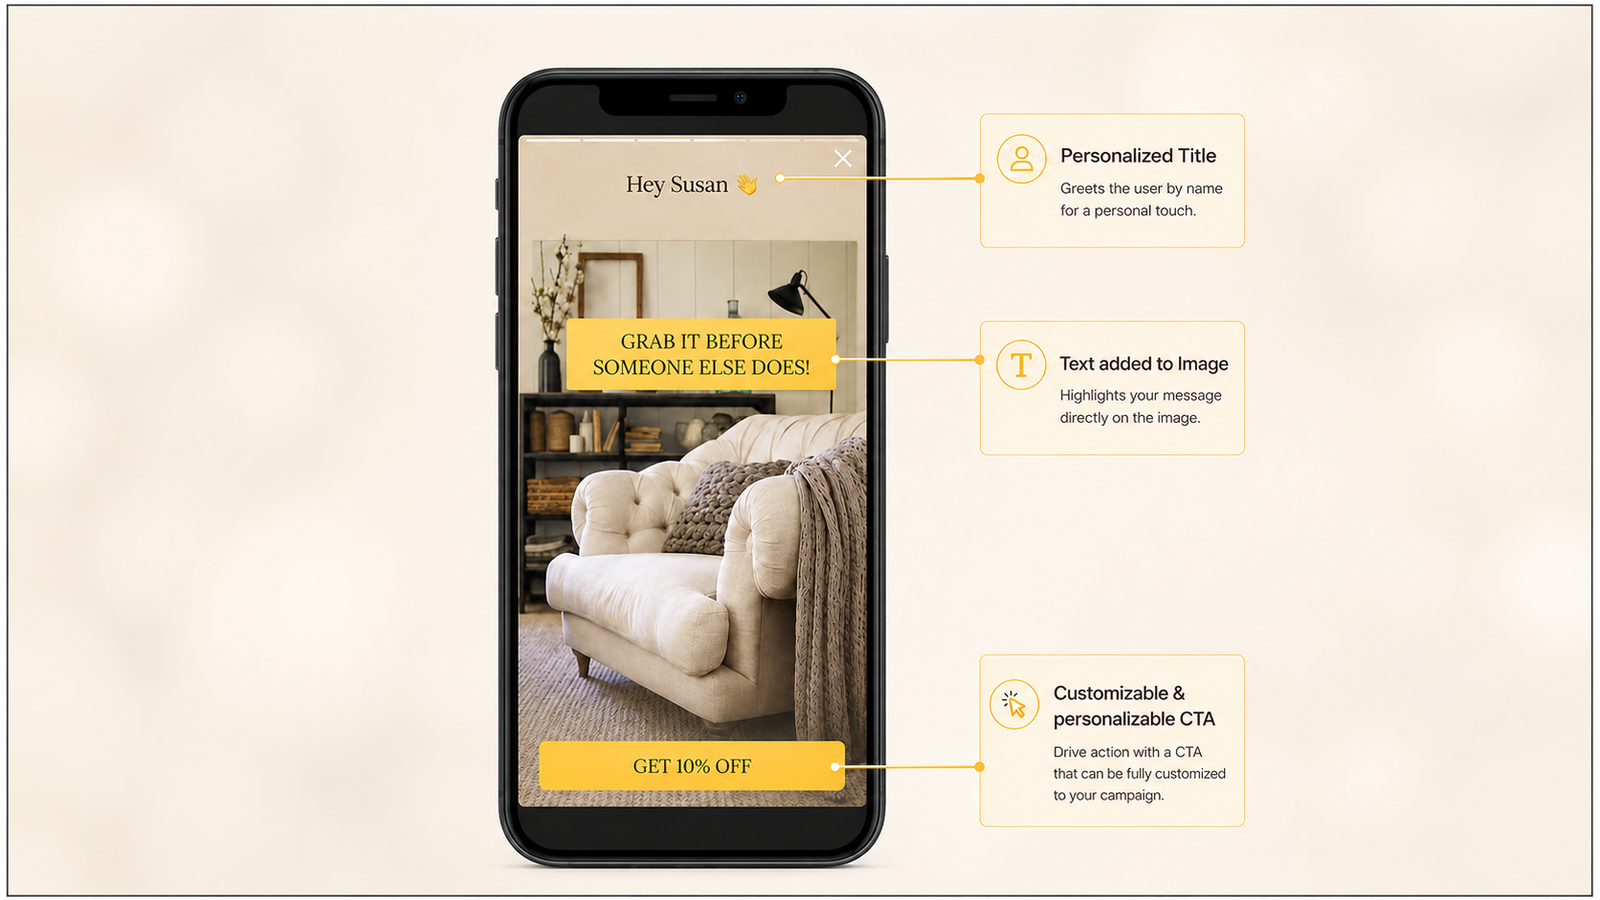
Where the CTA belongs. Given the drop-off shape above, a CTA placed only on the final frame is placed at the point where the smallest surviving audience will ever see it. A CTA embedded earlier, once the sequence has passed the steep initial exit window, typically frame three or four onward, reaches a meaningfully larger share of viewers while still benefiting from whatever narrative or educational build the preceding frames established. The correct placement depends on the specific goal: a sequence built purely for narrative or educational completion can reserve the CTA for the end, while a sequence built primarily for conversion should consider surfacing the CTA earlier, or repeating it across multiple later frames, rather than betting the entire outcome on the smallest, most-filtered audience segment that reaches the final frame.
Reading completion rate correctly. Completion rate is calculated as viewers who reached the last frame divided by viewers of the first frame, and a benchmark above 70% is considered strong, while below 50% signals content that is either too long or simply not landing. But a sequence with average overall completion can still be performing well if it holds attention strongly after the first few frames, since the early exits frequently tell a more diagnostic story than the final completion number alone. A team that only tracks the single aggregate completion percentage is discarding the exact data, frame-by-frame exit rate, that would tell them which specific frame to fix.
Placement and Entry Points
Where a stories sequence is discoverable determines both how many users encounter it and what state of mind they are in when they do, and each placement carries a distinct discovery tradeoff.
Home surface trays. A persistent row of story entry points on the home screen produces the highest raw discovery volume, since it is visible to every user on every session regardless of what they are doing. The tradeoff is relevance: content surfaced to the entire user base indiscriminately is less likely to match any specific viewer's actual interest or intent, which is part of why the drop-off curve's steep opening-frame exit rate exists in the first place, a meaningful share of the audience encountering the tray was never the right audience for that specific sequence.
Contextual triggers. A sequence surfaced specifically because a user's behaviour indicated relevance, viewing a specific product category, reaching a specific point in an onboarding flow, produces a smaller but more qualified audience. The tradeoff runs in the opposite direction from a home tray: lower raw reach, but a materially better match between content and viewer, which should produce a stronger completion curve for the audience it does reach.
Post-action placement. The moment immediately after a completed action, a purchase, a booking, an onboarding step, is the highest-attention, lowest-competition surface in an entire session, because the user has just finished the task the app exists to facilitate and has nowhere else for their focus to go in that instant. A stories sequence placed here trades broad discoverability for a moment of genuinely captive attention, which is well suited specifically to sequences whose content is a direct continuation of what the user just did, a delivery status walkthrough, a cross-sell sequence tied to the item just purchased, rather than a generic promotional sequence unrelated to the triggering action.
Use Cases Beyond Marketing
The format's mechanical advantages apply with equal or greater force to several categories of content that have nothing to do with promotion, and these are frequently underused specifically because stories get mentally filed as a marketing format by default.
Feature education. A new or underused feature explained across three to five frames, each covering one specific aspect, benefits directly from the format's tap-to-advance mechanic, letting a user control their own pace through a multi-part explanation rather than absorbing a single dense tooltip or scrolling past a static help article.
Onboarding. A sequential walkthrough of a product's core value proposition, delivered as a stories sequence rather than a traditional linear tour, inherits the format's completion-loop pull, giving a new user a visible reason to finish the sequence rather than dismissing it partway through the way a standard onboarding tour is frequently abandoned.
Policy explanation. For content that carries genuine regulatory or compliance weight, a stories sequence can break a dense policy change or a required disclosure into digestible, sequential pieces, provided the format's brevity is used to sequence the information rather than omit any of its substance, a distinction covered directly in the regulated-industry context of how progressive disclosure is applied specifically to financial risk communication.
Product updates. A changelog delivered as a stories sequence, walking through what changed and why it matters, is measurably more likely to actually be read than the same content published as a static release-notes page a user has to seek out and scroll through on their own initiative.
Measurement: Completion Rate, Per-Frame Drop-Off, CTA Conversion, and the Watched-Versus-Understood Gap
Completion rate and per-frame drop-off should be tracked together, not as alternatives, for the reason established earlier: the aggregate completion number tells a team whether a sequence is working overall, while the frame-by-frame breakdown tells them exactly which specific frame to fix if it is not. Retention data shows precisely which part of a sequence is underperforming, which means the correct response to a weak result is fixing the specific weak frame, not redesigning the entire sequence from scratch.
CTA conversion should be measured as a distinct metric from completion rate, since a sequence can achieve strong completion, meaning viewers stayed through every frame, while still producing weak CTA conversion if the call to action itself is poorly placed or poorly worded. These are two separate failure modes requiring two separate fixes, and collapsing them into a single "did the sequence work" verdict obscures which one actually needs attention.
The gap between watched and understood. This is the measurement dimension most stories implementations miss entirely, because view-through metrics, impressions, completion rate, frame-level retention, measure exposure, not comprehension. A user who tapped through every frame of a policy explanation or a complex feature walkthrough has been exposed to the content. Whether they actually absorbed and retained it is a genuinely different question that requires a different measurement approach: a brief, low-friction comprehension check immediately following the sequence, a single-question survey or an embedded quiz frame, is the only reliable way to distinguish a sequence that was watched from one that was understood, and this distinction matters most precisely for the non-marketing use cases covered above, where the actual goal is comprehension, not exposure.
Shipping Without a Release
None of the design and measurement discipline above is operationally useful if editing a sequence requires a new app build every time a team wants to test a different opening frame, adjust a CTA's position, or update a policy explanation after a regulatory change.
Server-driven delivery is the specific architectural requirement that makes a stories sequence genuinely editable after launch. When a sequence's structure, its frame order, its assets, its CTA placement and destination, is configured and delivered from a backend rather than compiled into the app binary, a team can adjust any of these elements from a dashboard and have the change reach users without submitting a new build to app store review. This is not a marginal convenience. It is the difference between a sequence a team can actually iterate on using the frame-level drop-off data covered above, fixing the specific weak frame the data identifies, and a sequence that is effectively frozen the moment it ships, since testing an alternative opening frame would otherwise require waiting on a full release cycle for every single variant.
The asset pipeline that supports this needs to account for the video-specific delivery requirements covered earlier in this article, not just text and static image content. This means the backend delivering sequence configuration also needs to handle adaptive bitrate variant selection, serving the correctly encoded version of a given video asset based on the requesting device's actual network conditions, rather than delivering a single fixed encode to every viewer regardless of connection quality. A server-driven architecture that only handles sequence structure and layout, without also handling video-specific delivery optimisation, solves half the problem covered in this article and leaves the other half, the actual playback experience on a constrained network, unaddressed.
Topics Not in the Brief That Teams Should Know
Accessibility for stories content requires deliberate design, not an assumption that the format is inherently accessible. A majority of users watch stories-format content with sound off by default, which means any content relying on voiceover or dialogue without visible captions loses meaningful context for a significant share of its actual audience, independent of any formal accessibility requirement. Speech-to-text captioning, styled and positioned deliberately rather than left as a default overlay, is a fast, low-effort fix that measurably improves retention specifically for audio-dependent content, and it should be treated as a standard production step for any video-based sequence, not an optional accessibility add-on considered only after the fact.
Single-sequence data is noisy, and a team should resist drawing conclusions from any one sequence's results in isolation. Trends across twenty or thirty sequences are what actually carry diagnostic meaning, since a single sequence's performance can be skewed by factors unrelated to its own design quality, timing, audience composition on that specific day, a concurrent competing campaign. A frame-level optimisation decision made off one sequence's data risks over-correcting for noise rather than genuine signal.
Posting or delivery cadence affects retention independent of any single sequence's own quality. Consistent, regular delivery has been linked to measurably higher follower or user retention compared to sporadic publishing, which suggests the broader rhythm of how often a product surfaces new stories content matters as its own variable, separate from the quality of any individual sequence, and worth tracking as a distinct metric in its own right.
DPDP compliance applies directly to any personalised video content, not just to text-based targeting. With India's Digital Personal Data Protection Act in full effect, any tool or pipeline used to personalise video content specifically needs to account for data residency and consent-first data handling, which is a distinct compliance consideration from the general in-app personalisation and consent architecture covered elsewhere, since video asset generation and delivery pipelines frequently involve third-party rendering or transcoding infrastructure that itself needs to be evaluated against the same data-handling standard.
Key Takeaways
Stories work mechanically through autoplay, tap-to-advance, full-screen focus, and a completion loop, but these mechanisms only activate for content that is genuinely sequential and suited to full-screen, self-paced consumption, not for a single promotional message wrapped in a stories shell.
Video delivery on real Indian network conditions requires codec selection matched to device generation, AV1 for modern mid-range chipsets and HEVC as the reliable fallback for older 4G handsets, aggressive preloading of the next frame during current playback, and adaptive bitrate serving different quality levels to different network conditions rather than a single fixed encode.
The measured drop-off curve has a specific, consistent shape: roughly 24% exit on the opening frame alone, declining steadily to a steadier 13 to 16% range by frames four through nine, which means design effort belongs disproportionately on the opening frame, and CTA placement should account for how much of the audience has already exited by the point any given frame appears.
Placement carries a discovery tradeoff in every case: home surface trays maximise reach at the cost of audience relevance, contextual triggers improve relevance at the cost of raw reach, and post-action placement trades broad discoverability for a moment of genuinely captive attention best suited to content that directly continues what the user just did.
The format's advantages extend well beyond marketing into feature education, onboarding, policy explanation, and product updates, use cases frequently overlooked because stories default to being mentally filed as a promotional format only.
Completion rate and per-frame drop-off should be tracked together rather than as alternatives, and the gap between a sequence being watched and being genuinely understood requires a distinct comprehension-check measurement, not inferred from exposure metrics alone.
Server-driven delivery, covering both sequence structure and adaptive video asset delivery, is the architectural precondition for genuinely iterating on a sequence using frame-level data after it has already launched, rather than treating the sequence as frozen the moment it ships.
Further Reading
From Digia Engage:
- In-App Storytelling: How to Use Stories Format to Drive Engagement — the full psychological and mechanical breakdown of why the stories format works, the companion piece this article builds on
- Urban Company's Post-Order Screen: A Deep Teardown — the post-action attention-window principle referenced in this article's placement section
- In-App Experiences for Fintech and BFSI Apps in India — the progressive disclosure discipline referenced in this article's policy-explanation use case
- Mobile App Onboarding Is a Growth Lever, Not a UX Checklist — the server-driven architecture argument this article's shipping section extends to video specifically
- Digia Engage In-App Videos — picture-in-picture, full-screen, and story video formats configurable without engineering tickets
External Sources:
- Video Optimization for Low Bandwidth: AI Tools for India 2026 — TrueFan AI (AV1, HEVC, and H.264 codec guidance; specific bitrate and VMAF targets for mobile screens)
- Bandwidth-Friendly Video AI Tools for India in 2026 — TrueFan AI (OpenSignal India network data; 12% conversion lift per second of load time reduction; adaptive bitrate and DPDP compliance guidance)
- How to Optimize a Video For Low Bandwidth? 8 Steps — ioRiver (preloading and caching mechanics)
- Instagram Stories Video Length (2026) — Moonb (frame-length pacing guidance; the 161,000-Story drop-off curve analysis)
- Instagram Stories Statistics 2026: Completion Rates, Views & Engagement Benchmarks — UpGrow (frame-by-frame exit rate breakdown; sequence length benchmarks by goal)
- Instagram Story Analytics 2025: Track Views, Exits & Engagement by Frame — SociaVault (completion rate formula and benchmark thresholds)
- A Guide to Using Instagram Story Analytics — Predis AI (sound-off viewing behaviour and captioning; single-sequence data noise; per-frame diagnostic approach)
The video encoding, adaptive delivery, and server-driven sequence architecture described in this article are native to Digia Engage's In-App Video and Widgets product lines, letting a sequence's structure, assets, and CTA placement be edited from a dashboard after launch, without an app release. Book a demo to see how frame-level performance data can inform a live sequence edit in the same week the data comes in, or read the companion stories psychology article for the full mechanical case behind the format.