
There is a point in almost every mobile team’s journey where analytics feels solved. The dashboards are in place, events are flowing, and every key metric appears neatly organized. It creates a sense of control, as if user behavior has been translated into something measurable and predictable.
That feeling usually lasts until something unexpected happens. Growth slows down without a clear reason, conversion drops without a visible break, or retention declines even though nothing obvious has changed. The data is there, but the explanation is not.
This is where most teams make a critical mistake. They assume the problem is tooling, not thinking. They add more tools, switch platforms, or rebuild their stack, believing better software will create better answers. In reality, tools rarely fix analytics problems. They only expose the gaps in how teams think about user behavior.
Why Most Teams Choose the Wrong Analytics Tools
Analytics stacks are often built too early and with the wrong priorities. Instead of starting with questions, teams start with tools. They look at what successful companies are using and try to replicate that setup, assuming the same tools will produce the same outcomes.
This creates a stack that looks sophisticated but lacks direction. Dashboards become crowded with metrics that are easy to track but hard to act on. Teams spend more time navigating tools than understanding users.
“When tools are chosen before problems are defined, analytics becomes reporting, not reasoning.”
The core issue is not the absence of data. It is the absence of a clear analytical model that connects user behavior to business outcomes.
The 3 Types of Mobile Analytics Tools
Before evaluating specific tools, it is important to understand the roles they play. Most mobile analytics platforms fall into three categories, and each one answers a different type of question. Confusion begins when teams expect one category to solve problems that belong to another.
Product Analytics Tools (Understanding User Behavior)
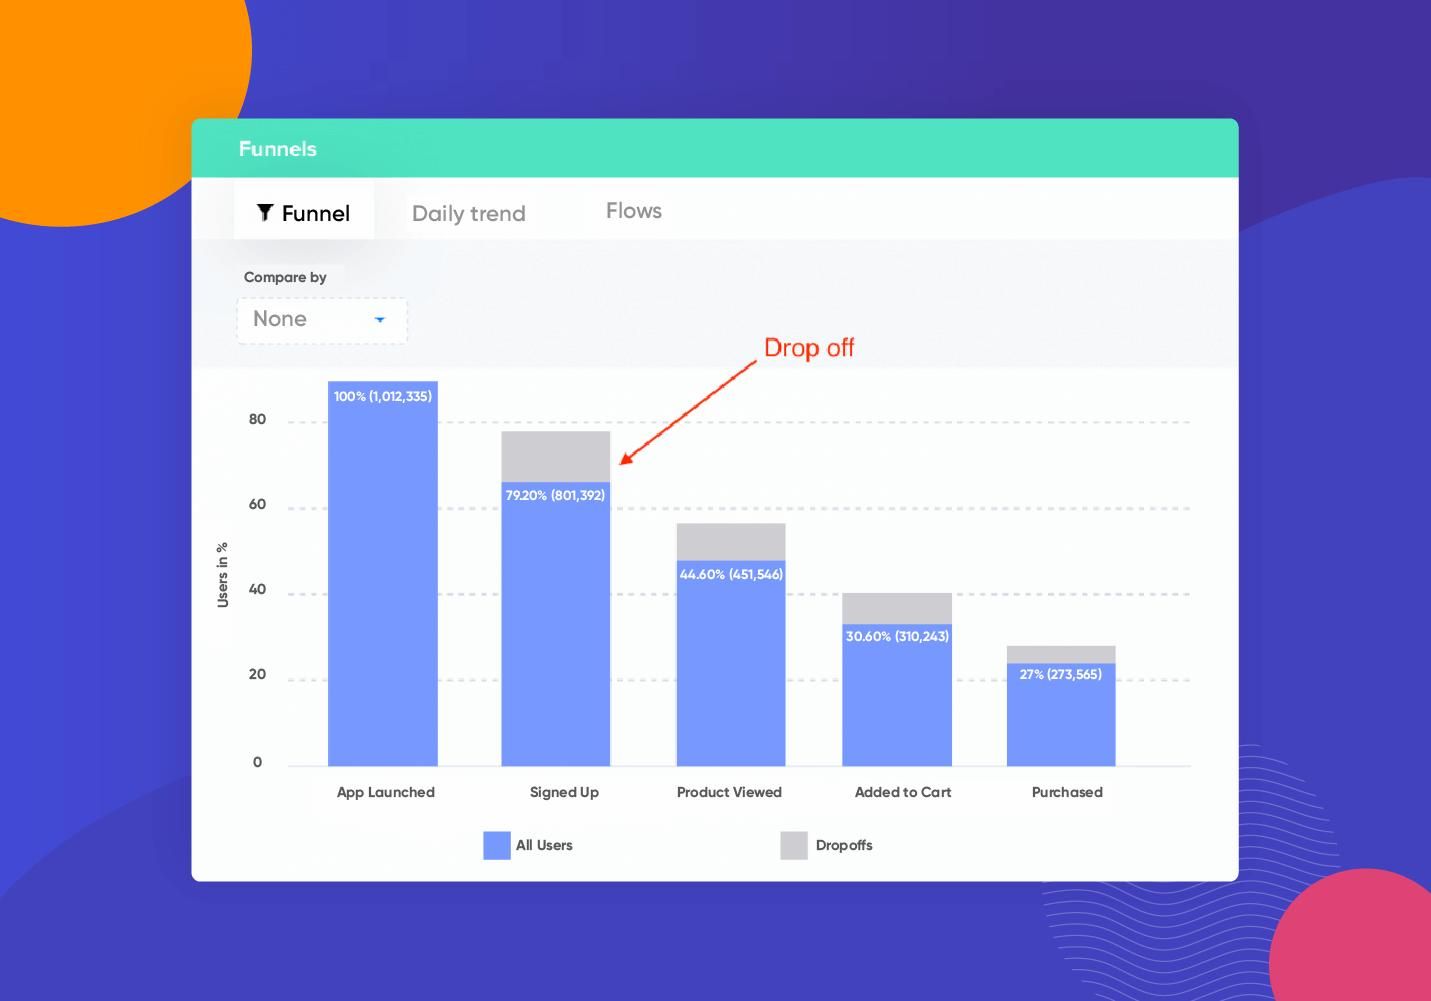
Product analytics tools are designed to capture what users do inside an app. They track events, measure funnels, and show how users move through different flows. This makes them essential for understanding engagement patterns and identifying friction points.
Platforms like Google Analytics for Firebase, Mixpanel, and Amplitude are widely used for this purpose. They provide visibility into retention, session behavior, and feature usage.
However, their strength is also their limitation. They describe behavior but do not explain intent. A drop in a funnel can be observed, but the underlying reason remains outside the scope of the tool. Without qualitative context or hypothesis-driven analysis, teams risk misinterpreting what they see.
Attribution Tools (Understanding Where Users Come From)
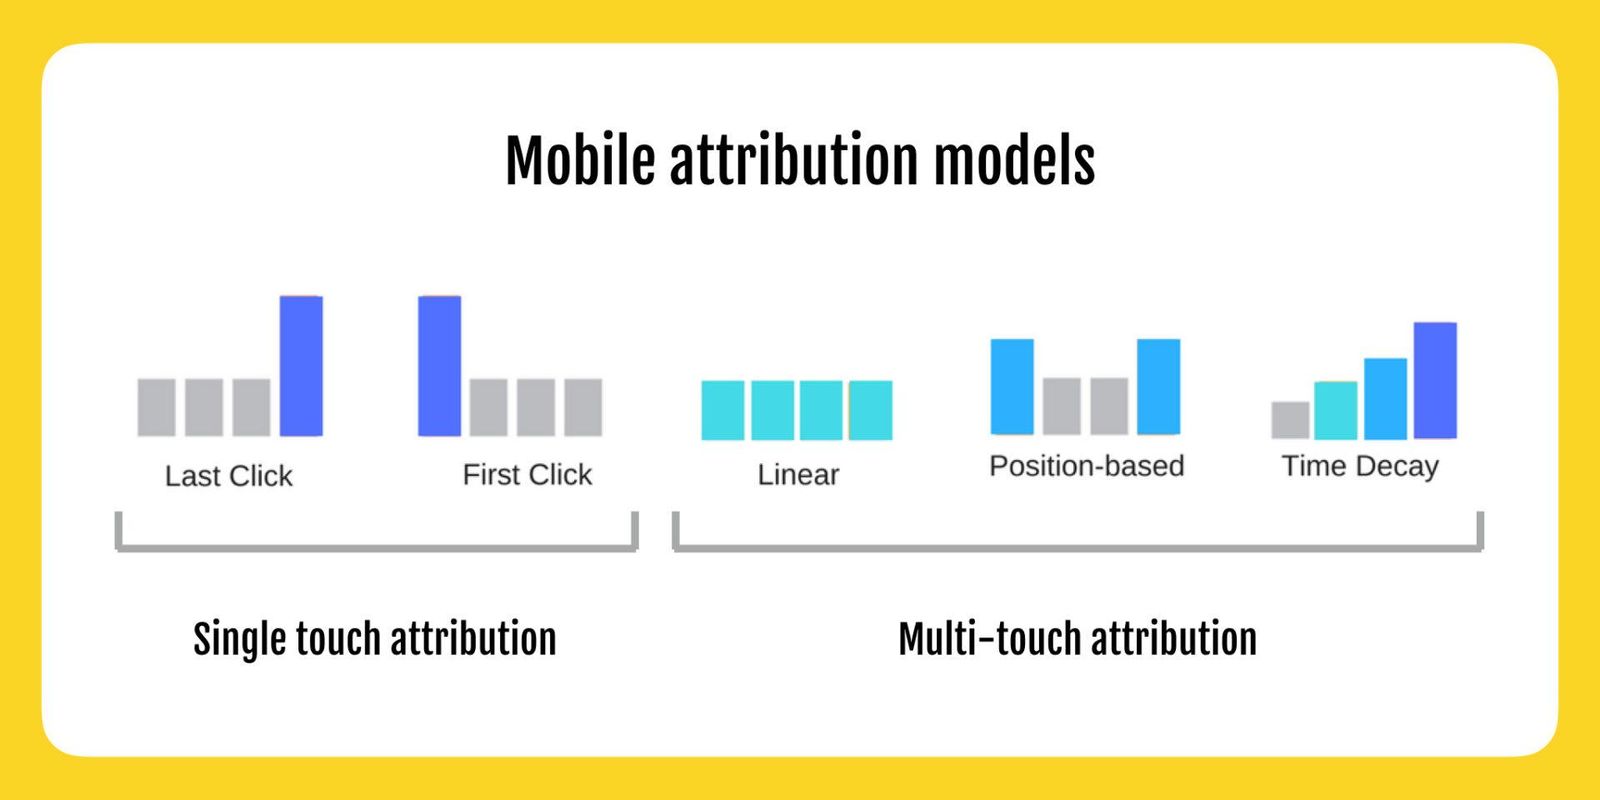
Attribution tools focus on acquisition. They identify which campaigns, channels, or sources are responsible for bringing users into the app. This becomes critical once a team starts investing in paid growth or managing multiple acquisition channels.
Tools such as AppsFlyer, Adjust, and Branch specialize in tracking installs, clicks, and campaign performance.
The limitation lies in what they optimize. Attribution tools are designed around installs and short-term metrics like cost per acquisition or return on ad spend. They do not inherently measure whether those users generate long-term value. This creates a gap between acquisition efficiency and product success.
Experimentation Tools (Understanding What Changes Work)
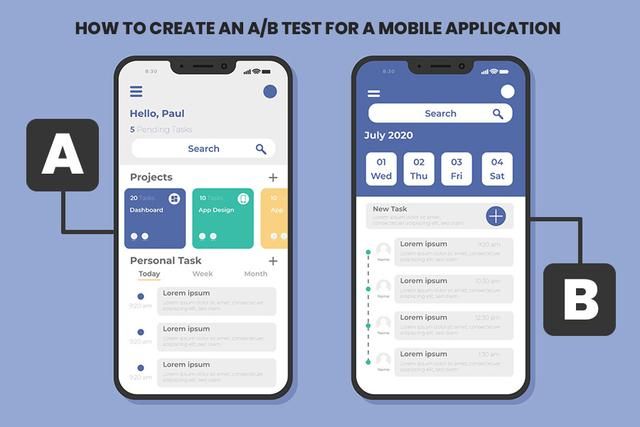
Experimentation tools introduce a structured way to test changes. They allow teams to compare different versions of a feature, onboarding flow, or interface and measure which one performs better.
Examples include Firebase Remote Config, Optimizely, VWO, and Split.io. These platforms bring statistical rigor into decision-making.
The challenge is that experiments often optimize isolated metrics. A change that improves conversion at one step may negatively impact retention later. Without a system-level view, experimentation can lead to local gains but global inefficiencies.
Top 10 Mobile App Analytics Tools
The value of these tools becomes clearer when they are viewed in context rather than as a flat list. Each category solves a specific part of the analytics problem.
| Category | Tool | Primary Use Case | Best For |
|---|---|---|---|
| Product Analytics | Google Analytics for Firebase | Event tracking and funnels | Early-stage teams and Firebase ecosystem |
| Product Analytics | Mixpanel | Behavioral analysis and segmentation | Growth-focused product teams |
| Product Analytics | Amplitude | Advanced product insights and cohorts | Mature analytics setups |
| Attribution | AppsFlyer | Campaign attribution and performance | Paid acquisition at scale |
| Attribution | Adjust | Fraud prevention and attribution | Performance marketing teams |
| Attribution | Branch | Deep linking and attribution | User journey continuity |
| Experimentation | Firebase Remote Config | Feature control and testing | Lightweight experimentation |
| Experimentation | Optimizely | A/B testing and experimentation | Data-driven product teams |
| Experimentation | VWO | Conversion optimization | Marketing and UX teams |
| Experimentation | Split.io | Feature flags and experimentation | Engineering-led experimentation |
Each tool performs well within its domain, but none of them is designed to replace the others. The mistake is expecting a single platform to provide a complete understanding of user behavior.
When to Use Each Tool
The usefulness of a tool depends less on its features and more on the stage of the product.
In the early stage, the primary goal is to understand whether users find value in the product. At this point, adding multiple tools creates unnecessary complexity. A single product analytics tool is usually sufficient to track user flows, identify drop-offs, and measure retention.
As the product enters a growth stage, acquisition becomes a priority. This is when attribution tools start to matter. However, they should not operate in isolation. Acquisition data needs to be connected with in-product behavior to evaluate user quality, not just volume.
In a mature stage, optimization becomes the focus. Small improvements can have a significant impact, and experimentation tools become valuable. But they should be used with clear hypotheses and aligned metrics, otherwise experimentation turns into random iteration.
How These Tools Work Together
Analytics only becomes meaningful when different layers are connected. Each category of tools captures a different part of the user journey, but insight emerges from how these parts interact.
A simplified way to understand this is through three layers:
| Layer | Question It Answers | Tool Category |
|---|---|---|
| Acquisition | Where did the user come from | Attribution |
| Behavior | What did the user do | Product Analytics |
| Outcome | Did the user find value and stay | Product + Experimentation |
When these layers are disconnected, teams optimize individual metrics without understanding their impact. When they are connected, analytics becomes a system that explains user behavior rather than just reporting it.
The Limitations of Each Category
Every tool category has inherent limitations, and understanding them is essential to avoid misinterpretation.
Product analytics tools provide detailed behavioral data, but they cannot capture user intent or external context. Attribution tools focus heavily on acquisition efficiency, often ignoring long-term value. Experimentation tools rely on statistical outcomes, which can be misleading without proper framing.
“A tool is only as accurate as the question it is used to answer.”
Recognizing these limitations is what prevents teams from over-relying on any single source of data.
The Core Insight: Tools Don’t Fix Broken Analytics Thinking
There is a common assumption that better tools lead to better decisions. In practice, the opposite is often true. More tools introduce more data, more dashboards, and more potential for confusion.
Teams that struggle with analytics rarely lack data. They lack a clear framework for interpreting it. Without that framework, even the most advanced tools become reporting systems rather than decision systems.
The difference lies in how analytics is approached. When it is treated as a system of understanding user behavior, tools become useful. When it is treated as a collection of metrics, tools become overwhelming.
How to Choose the Right Tool
Choosing the right tool starts with defining the decision it needs to support. This shifts the focus from features to outcomes. Instead of evaluating tools based on capabilities, teams should evaluate them based on the clarity they provide.
A practical approach is to keep the stack minimal and aligned with the product stage. Most teams do not need multiple tools in the same category. Overlapping tools create redundancy and increase the effort required to maintain consistency.
A simple structure is often enough:
- One product analytics tool for behavior
- One attribution tool if acquisition is a priority
- One experimentation layer when optimization becomes necessary
Anything beyond this should be justified by a clear need, not curiosity or trend.
Additional Considerations Most Teams Overlook
There are a few critical aspects of mobile analytics that are often ignored but significantly impact effectiveness.
Data Quality and Event Design
Poorly defined events lead to misleading insights. Naming conventions, event tracking structure, and consistency across platforms are foundational to reliable analytics.
Privacy and Compliance
With increasing regulations and platform restrictions, tracking accuracy is evolving. Attribution is becoming probabilistic, and teams must adapt their expectations accordingly.
Time-to-Insight
The value of analytics is not just in accuracy but in how quickly insights can be generated. Complex tools that slow down decision-making can reduce overall effectiveness.
Team Accessibility
Analytics should not be limited to data teams. Product managers, marketers, and designers should be able to access and interpret data without heavy dependency.
Conclusion
Mobile analytics tools are powerful, but they are not self-sufficient. They provide visibility, not understanding. They capture behavior, not meaning.
The real leverage comes from how these tools are used together and how the data is interpreted. A well-structured analytical approach can make even simple tools effective, while a poorly defined approach can make advanced tools useless.
In the end, analytics is not about building the perfect stack. It is about building a system that connects user behavior to real decisions.
And that system is defined not by tools, but by thinking.