Mobile apps are often judged by their growth metrics. Product dashboards highlight install numbers, acquisition campaigns are evaluated based on download spikes, and app store rankings are used as indicators of success. When an app reaches tens or hundreds of thousands of installs, it is easy to assume that the product is performing well.
However, installs rarely tell the full story.
Many mobile apps experience a sharp drop in engagement shortly after users download them. People install the app, open it once or twice, and then quietly disappear without returning. The app remains installed on their device or gets deleted entirely.
This phenomenon is known as user churn, and it represents one of the most significant challenges in mobile product growth.
User churn measures the percentage of users who stop using an app during a given time period. In an ecosystem where thousands of apps compete for limited user attention, churn can quickly undermine even the most successful acquisition campaigns.
Understanding and reducing churn is therefore essential for sustainable mobile growth.
Why Churn Is the Silent Killer of Mobile Growth
At first glance, churn appears to be just another product metric alongside installs, daily active users, and session counts. But churn reveals something deeper about how users perceive the product.
When users stop using an app, they are effectively signaling that the product failed to deliver enough value to justify continued engagement.
This problem becomes particularly expensive for companies investing heavily in user acquisition. If newly acquired users abandon the product within days, the cost of acquiring them often exceeds the revenue they generate.
In this scenario, growth becomes unsustainable.
Retention therefore becomes the foundation of long-term app success. Apps that maintain strong retention can grow steadily because each new group of users adds to the existing base. Apps with high churn, however, must constantly replace lost users simply to maintain the same level of activity.
For this reason, churn is often considered a product health indicator rather than just a marketing metric.
What is user churn and where to find it?
App user churn refers to the percentage of users who stop engaging with an app during a specific period of time. While retention measures how many users continue using the product, churn measures how many users leave.
Although the concept seems straightforward, churn can occur in several ways depending on how users disengage from the product.
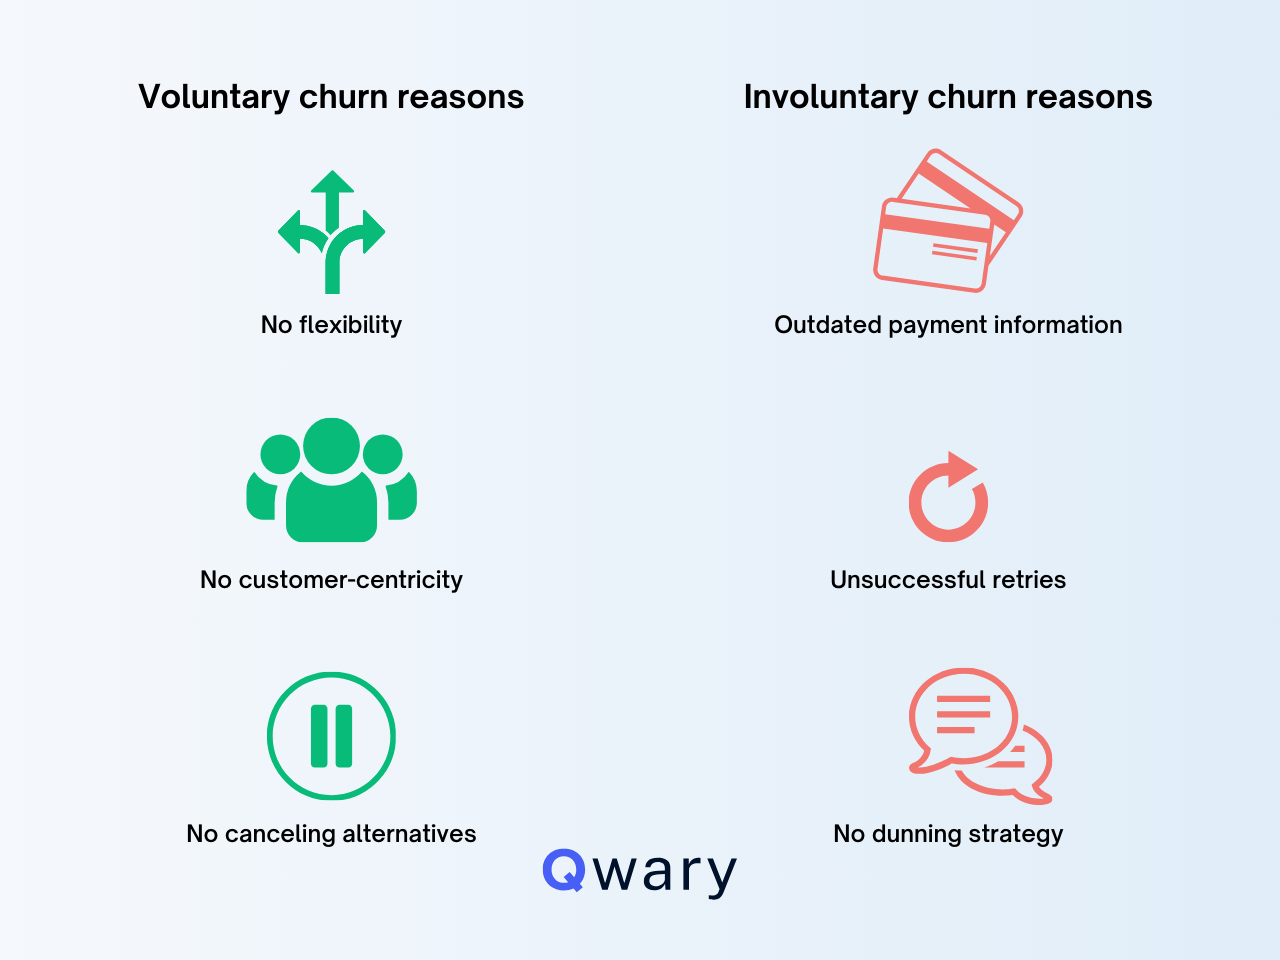
Voluntary churn
Voluntary churn occurs when users intentionally stop using the app. This may involve uninstalling the application or simply ignoring it after a few sessions. In most cases, voluntary churn results from dissatisfaction with the product experience.
Users may feel that the app does not provide enough value, that it is too complicated to navigate, or that it does not solve the problem they originally downloaded it for.
Involuntary churn
Involuntary churn occurs when users stop engaging due to external or technical issues rather than deliberate decisions. For example, failed payments, expired credit cards, login problems, or subscription issues may prevent users from continuing to use the service.
Although involuntary churn may seem less severe, it can still lead to lost users if not addressed quickly.
Common reasons why users churn
Several common factors consistently contribute to user churn across different types of apps.
- Lack of perceived value or unmet expectations
- Poor user experience
- Confusing navigation or difficult interfaces
- Excessive advertisements or intrusive notifications
- Technical issues such as crashes or bugs
- Complicated sign-up or onboarding processes
- Features that do not align with user needs
In most cases, churn occurs when users fail to understand the value of the product early in their journey.
App user churn key statistics
Industry research highlights just how widespread churn is in the mobile ecosystem.
| Metric | Insight |
|---|---|
| Average Android churn rate | 97.9% |
| Average iOS churn rate | 96.3% |
| Day-1 churn | Most users churn after their first session |
| Day-30 churn | Over 95% of users churn on both platforms |
| Highest churn category | Photo and Video apps |
| Lowest churn category | News apps |
| Country with highest churn | China (98.5%) |
| Subscription inactivity | Over 50% of annual subscribers become inactive |
These numbers reveal an important reality: the majority of users who install an app never become long-term users.
Measuring user churn: How to catch it on time
Reducing churn starts with measuring it accurately.
The most basic churn rate formula is:
Churn Rate = (Users lost during period ÷ Total users at start of period) × 100
While this calculation provides a general overview, meaningful churn analysis requires deeper investigation.
Segmenting churn
Different groups of users often churn for different reasons. For example, new users may churn because onboarding is confusing, while long-term users may churn due to missing features or declining value.
Segmenting users into groups such as new users, repeat users, and paying customers helps identify the specific causes behind churn.
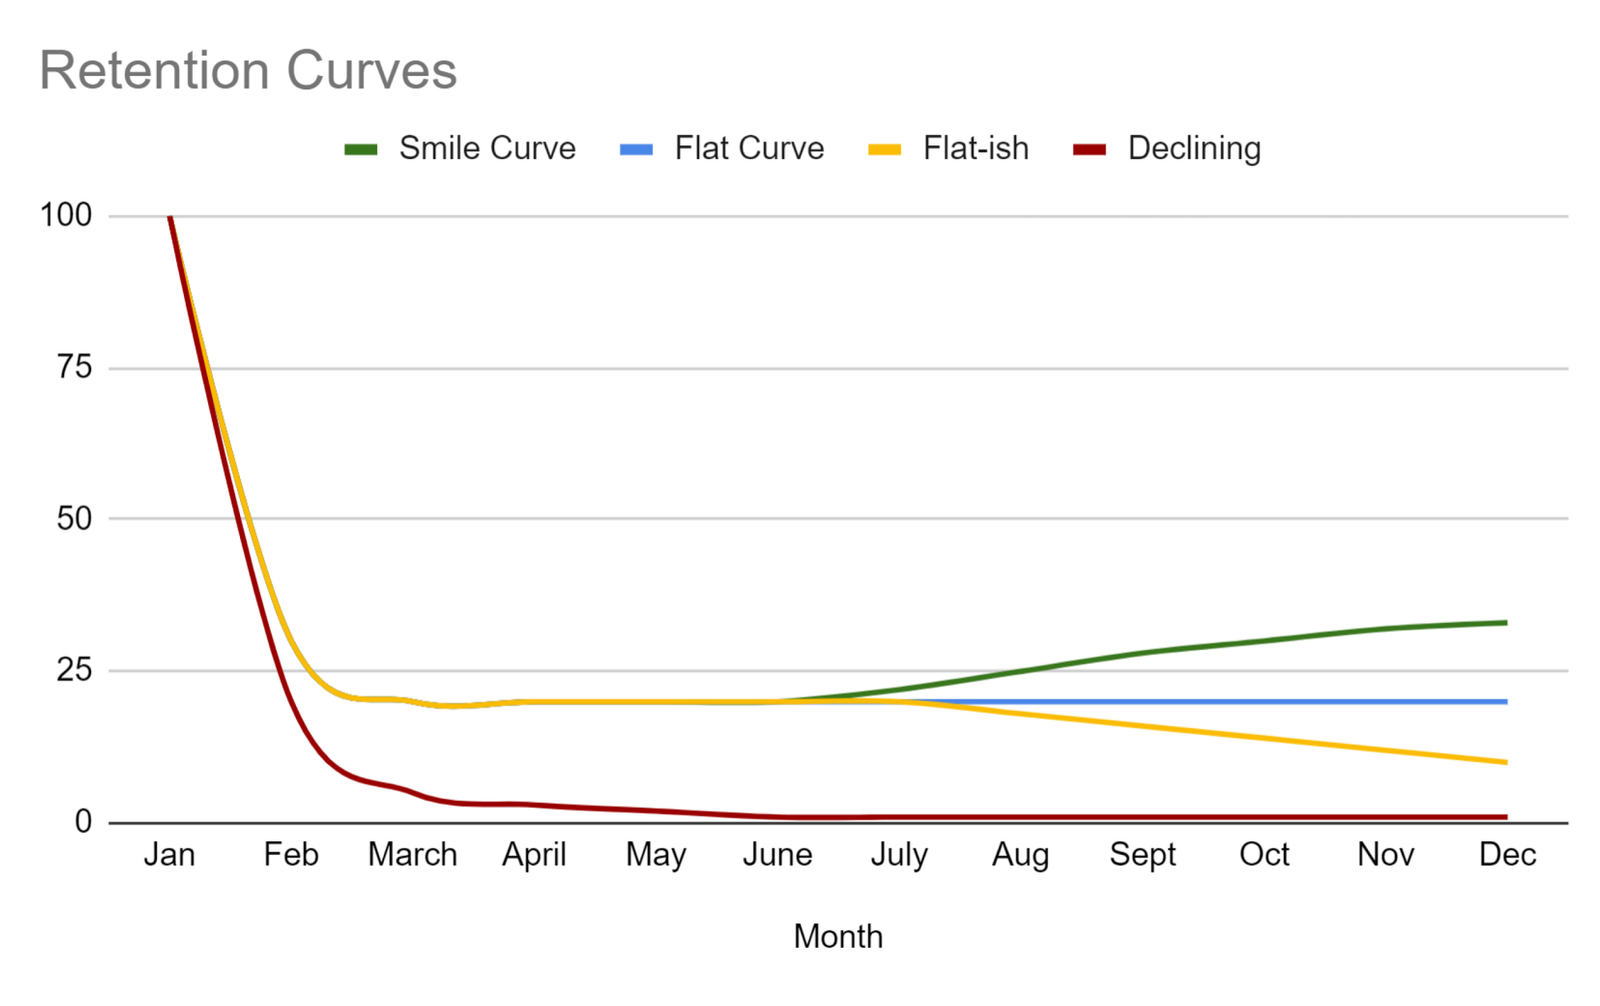
Cohort analysis
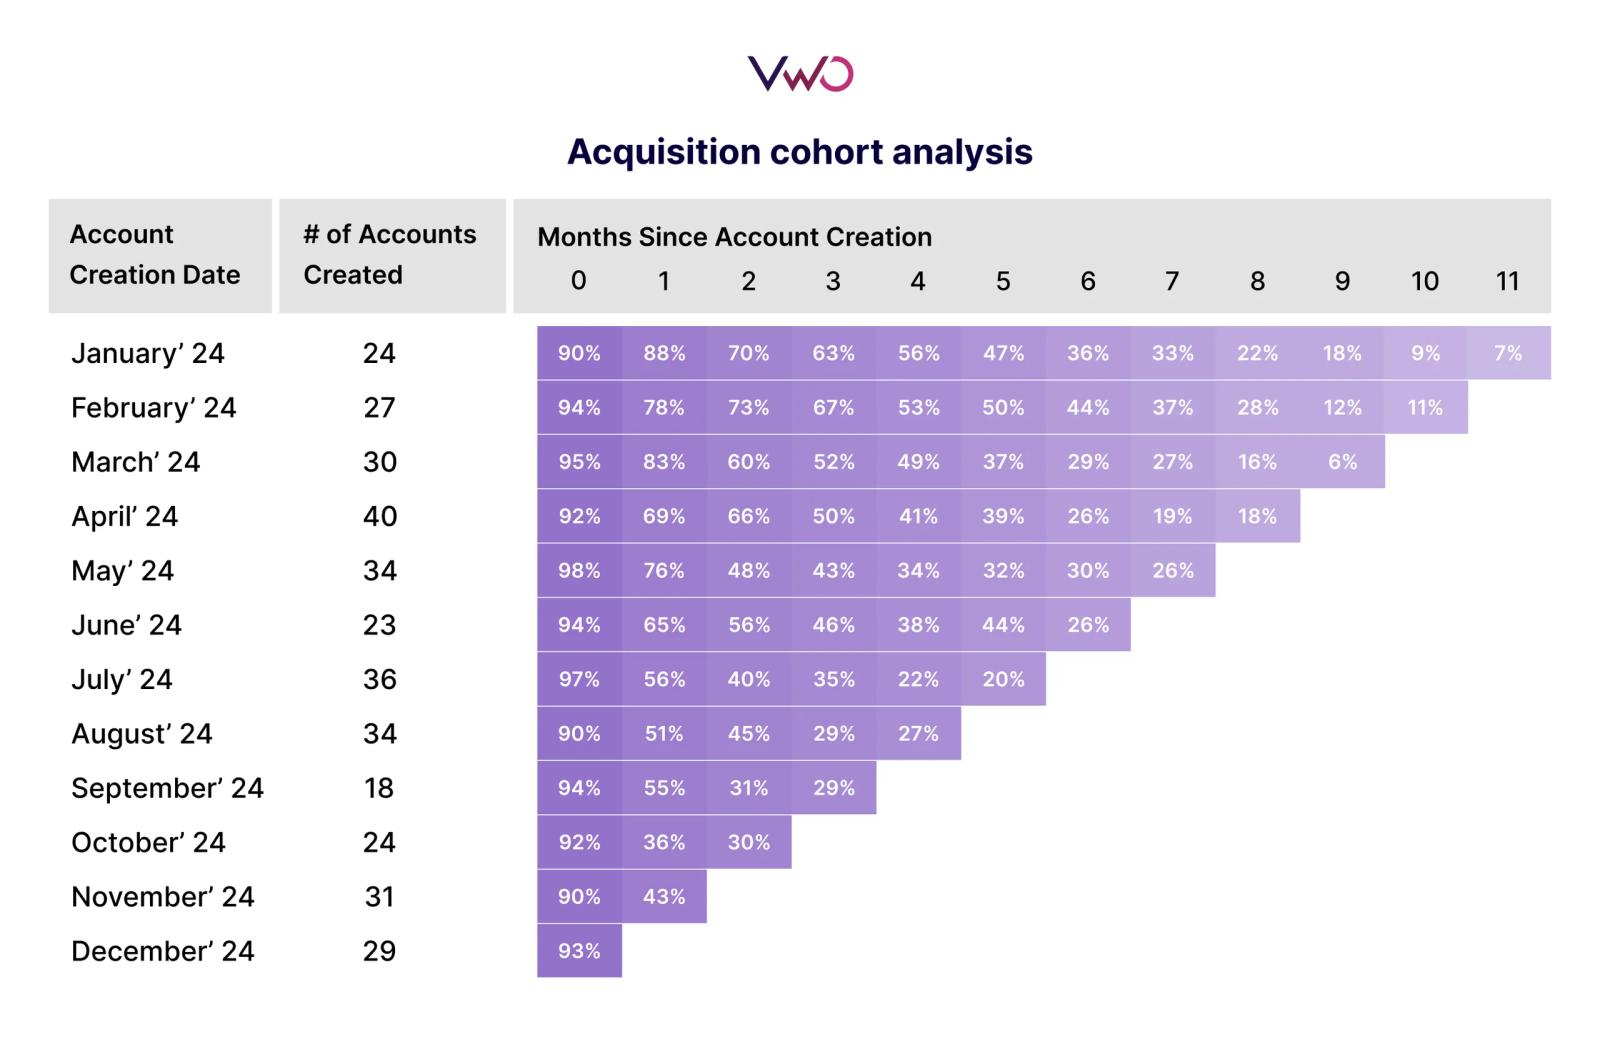
Cohort analysis is one of the most effective techniques for understanding retention patterns.
A cohort groups users who share a common attribute, such as the month they installed the app or a campaign through which they were acquired. By comparing engagement patterns across cohorts, teams can identify when and why retention begins to decline.
Behavioral indicators
User behavior often signals churn before it happens. Early indicators may include fewer sessions, shorter engagement times, or reduced interaction with important features.
Monitoring these signals allows product teams to intervene before users completely disengage.
Feedback analysis
User feedback also provides valuable insights into churn drivers. Monitoring reviews, support tickets, and survey responses can highlight recurring issues that push users away.
Addressing these issues early prevents them from affecting a larger portion of the user base.
Early warning signals of churn
Churn rarely happens suddenly. Instead, it develops gradually as user engagement declines.
For example, a user who initially opens the app several times a week may begin visiting less frequently. They might stop exploring new features, ignore notifications, or abandon key actions such as purchases or content interactions.
These behavioral shifts often indicate that the user is losing interest in the product.
Identifying these signals early enables teams to intervene through targeted messaging, improved onboarding experiences, or personalized incentives designed to re-engage the user.
Strategies and best practices to slash churn and keep users hooked
Reducing churn requires improving the moments where users decide whether the app is worth returning to.
While every product has unique retention challenges, several strategies consistently help mobile apps retain more users.
Improve the onboarding journey
Onboarding represents the first meaningful interaction between users and the product.
During this phase, users evaluate whether the app can solve their problem or deliver the experience they expected. If onboarding fails to communicate value quickly, many users leave before exploring the core features.
Effective onboarding focuses on clearly presenting the product’s benefits while guiding users toward key actions that demonstrate its value.
Keeping the onboarding experience simple and engaging can significantly improve retention.
Personalization, personalization, personalization
Personalization helps apps create experiences that feel relevant to individual users.
Instead of delivering identical content or messages to everyone, apps can tailor notifications, recommendations, and offers based on user behavior, preferences, and interaction history.
When users feel that the app understands their needs, they are more likely to continue using it.
Utilize push notifications wisely
Push notifications can effectively bring users back into an app, but they must be used carefully.
Sending too many notifications or sending irrelevant ones often leads users to disable notifications or uninstall the app entirely.
The most effective notification strategies rely on segmentation and behavioral triggers to deliver messages that feel timely and relevant.
Offer time-sensitive rewards
Rewards and incentives can encourage users to remain active within an app.
Limited-time discounts, in-app credits, or milestone rewards create a sense of urgency that motivates users to return. Gamification strategies such as streak rewards or progress milestones can further strengthen engagement.
When rewards align with user interests, they become powerful retention tools.
Collect and act on feedback
User feedback helps identify areas where the product experience can improve.
In-app surveys, interviews, and review monitoring provide insights into user frustrations, feature requests, and usability issues.
Apps that actively respond to feedback and implement improvements demonstrate that they value user input, which strengthens loyalty.
Improve app performance
Performance issues such as slow loading times, crashes, or bugs quickly frustrate users.
Maintaining a stable and responsive app experience is essential for long-term retention. Regular testing, performance optimization, and quick bug fixes help ensure that technical issues do not drive users away.
Re-engagement campaigns
Inactive users can often be brought back through targeted re-engagement campaigns.
These campaigns may include reminders about unfinished actions, personalized offers, or content recommendations designed to reignite interest.
Using multiple channels such as email, push notifications, and targeted ads helps ensure that users remain aware of the app’s value.
Predictive user churn analysis
Predictive analytics allows teams to identify users who are likely to churn before they actually leave.
By analyzing behavioral patterns such as declining activity or reduced feature usage, predictive models can flag at-risk users early in their lifecycle.
Teams can then intervene with personalized messages or incentives designed to restore engagement.
Segment and prioritize users
Not all users contribute equally to an app’s success.
Some users generate significant revenue through subscriptions or purchases, while others interact with the app occasionally. Segmenting users based on engagement levels or spending habits allows teams to prioritize retention efforts effectively.
High-value users may benefit from personalized offers or exclusive experiences, while casual users may respond better to content updates or reminders.
Final thoughts
User churn is an unavoidable part of running a mobile app, but it does not have to be a constant threat to growth.
By understanding why users leave, measuring churn accurately, and implementing targeted retention strategies, mobile teams can significantly reduce user loss.
Improving onboarding experiences, personalizing engagement, optimizing performance, and leveraging predictive analytics all contribute to stronger retention outcomes.
Ultimately, reducing churn is about ensuring that users consistently experience value from the product.
When users quickly recognize that value and continue discovering new benefits over time, retention improves naturally and the cycle of acquiring users only to lose them begins to break.