
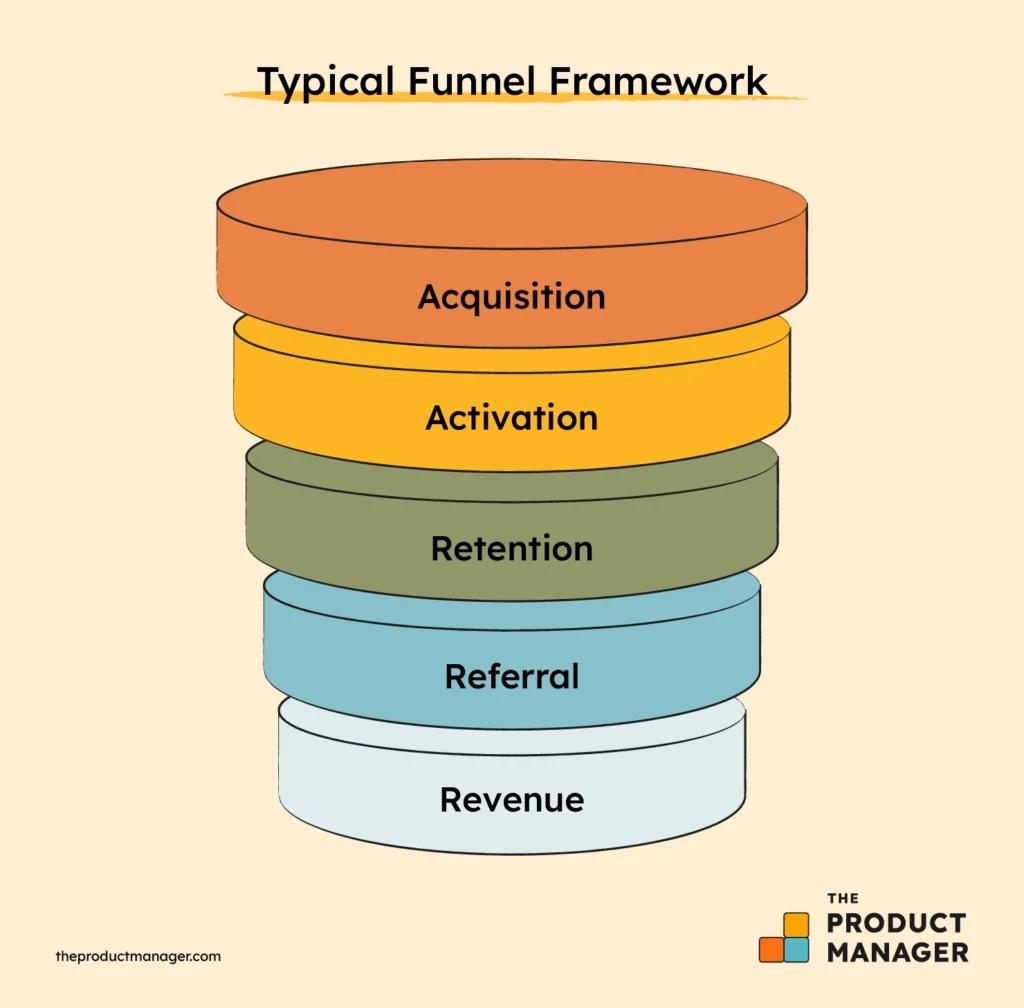
Mobile App Onboarding is not a UI sequence. It is a behavioral system designed to move a user from curiosity to commitment. Most teams reduce onboarding measurement to surface-level indicators such as tutorial completion or sign-ups. These metrics are easy to track but weak in predictive power. They do not explain whether a user experienced meaningful value, nor do they forecast retention or revenue performance.
If onboarding is the bridge between acquisition and retention, then onboarding metrics are your early warning system. They reveal whether your product delivers value fast enough, whether friction blocks momentum, and whether activation behavior compounds into long-term engagement. This article presents a comprehensive, production-grade framework for measuring mobile app onboarding with operational depth, mathematical clarity, and strategic alignment to growth.
Understanding Onboarding as a Measurable System
Onboarding is often treated as a feature. In reality, it is a cross-functional growth layer that spans product design, analytics, performance engineering, behavioral psychology, and monetization strategy.
A precise onboarding measurement model contains four structured phases:
| Phase | Objective | Primary Question |
|---|---|---|
| Acquisition Entry | Convert install into engagement | Do users start the journey? |
| Account & Setup | Reduce friction to usable state | Can users complete initial setup? |
| Activation | Deliver first core value | Did users experience meaningful value? |
| Early Retention | Reinforce habit loop | Do users come back after first session? |
These phases must be measured independently. Mixing them leads to misleading interpretations. For example, a high signup rate with low activation rate signals friction after account creation, not an acquisition problem.
Core Onboarding Metrics: Foundational Indicators
The following metrics form the backbone of onboarding analytics. Without them, optimization efforts lack direction.
Install-to-Signup Rate
Install-to-Signup Rate measures how effectively you convert downloads into account creation. It reflects clarity of value proposition and perceived effort.
Formula:
(Signups ÷ Total Installs) × 100
If this metric is low, the issue usually lies in misaligned expectations, forced account walls without context, or insufficient pre-signup value signaling.
Signup Completion Rate
This metric isolates friction within the registration flow itself.
Formula:
(Completed Registrations ÷ Signup Started) × 100
A low completion rate indicates excessive form complexity, multi-step fatigue, unclear field requirements, or psychological hesitation regarding data sharing. Progressive data collection often improves this metric significantly.
Activation Rate (The Most Critical Metric)
Activation must be defined explicitly. It is not a tutorial completion. It is the first meaningful action that delivers core product value.
Examples of activation events differ by category:
- Messaging app: first message sent
- Fintech app: first transaction completed
- Productivity app: first project created
- Fitness app: first workout logged
Formula:
(Users Who Complete Activation Event ÷ New Users) × 100
Activation rate predicts retention more accurately than any vanity metric in onboarding.
Time to Value (TTV)
Time to Value measures the duration between first open and activation event. It is one of the most under-optimized metrics in mobile growth.
You should track median TTV, 75th percentile TTV, and activation within first session.
A long TTV signals cognitive overload, excessive steps, performance lag, or unclear next actions. Shortening TTV often produces direct improvements in Day 1 retention.
Day 1 Retention
Day 1 retention measures whether users return after their first experience.
Formula:
(Users Active on Day 1 ÷ Users Who Installed) × 100
Onboarding compresses value delivery. Retention reflects whether that value felt worth revisiting.
Behavioral Diagnostic Metrics
Core metrics tell you what is happening. Diagnostic metrics explain why.
Drop-Off Rate by Step
Every onboarding step should be instrumented individually.
Step Drop-Off Rate =
(Users Who Exit at Step ÷ Users Who Reached Step) × 100
A sudden spike reveals friction. This may be caused by permission prompts, unclear instructions, or perceived effort exceeding perceived value.
Permission Acceptance Rate
Mobile apps often request sensitive permissions. Timing and framing directly influence acceptance.
Formula:
(Users Who Accept Permission ÷ Users Prompted) × 100
Requesting permissions before value demonstration reduces acceptance significantly. Delayed contextual permission prompts generally perform better.
Feature Adoption Rate (First 7 Days)
Activation alone is insufficient if users fail to explore core features.
Formula:
(Users Who Use Feature ÷ Activated Users) × 100
This metric reveals onboarding depth. Shallow onboarding may drive activation but fail to build engagement breadth.
Onboarding Completion Rate
Completion rate measures walkthrough completion but should never be mistaken for activation.
Many apps report high onboarding completion and weak retention. Completion without value is operationally meaningless.
Advanced Growth and Revenue Metrics
At scale, onboarding must connect directly to revenue and long-term value.
Activation Cohort Retention Analysis
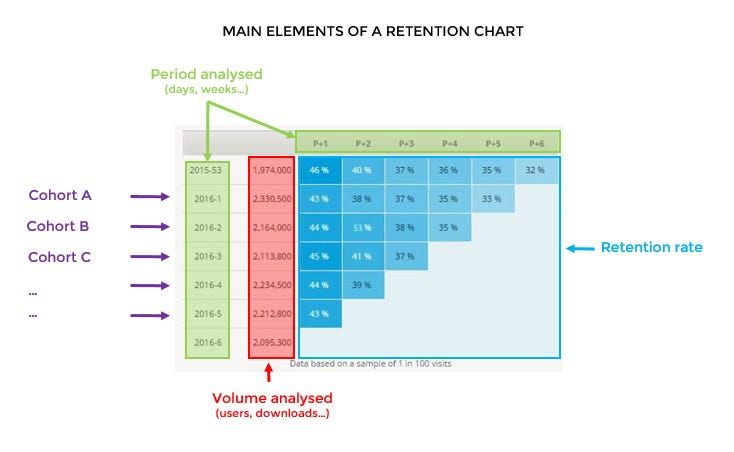
Segment users based on activation speed:
| Cohort | Activation Timing | Typical 30-Day Retention |
|---|---|---|
| Cohort A | Activated in first session | Highest |
| Cohort B | Activated within 24 hours | Moderate |
| Cohort C | Never activated | Minimal |
This analysis quantifies the causal link between onboarding quality and retention durability.
Activation-to-Paid Conversion Rate
Formula:
(Paid Users ÷ Activated Users) × 100
If this rate is low, activation may be too superficial, or monetization timing may be misaligned with perceived value.
Early Engagement Depth
Early engagement predicts habit formation. Track sessions per user in first 72 hours, core action frequency, and diversity of feature usage.
Higher engagement depth in early sessions correlates strongly with long-term retention curves.
Onboarding Revenue Lag
Measure time from activation to first purchase. If lag is long, your onboarding may fail to surface monetizable features effectively.
While behavioral and growth metrics measure user outcomes, performance metrics measure the technical conditions that influence those outcomes.
Performance Metrics Within Onboarding
Performance is part of onboarding. Perceived slowness directly increases abandonment.
Key technical metrics include:
- Screen load time
- Time to interactive
- API latency
- Crash rate during onboarding
- ANR (Application Not Responding) rate
A one-second delay during onboarding can meaningfully increase drop-off probability. Performance instrumentation must be integrated with behavioral analytics.
Psychological Metrics and Behavioral Signals
Onboarding operates within cognitive and emotional dimensions.
Cognitive Load Indicators
- Average time spent per onboarding screen
- Repeated back navigation
- Form error frequency
- Idle time before interaction
High cognitive load correlates with abandonment risk.
Motivation Drop Indicators
Users who rapidly skip instructional screens without interacting often demonstrate low engagement intent. Track skip velocity and interaction density.
Friction Index (Composite Metric)
Advanced teams create composite friction indices combining:
- Number of steps
- Fields required
- TTV distribution
- Drop-off spikes
- Permission rejection
This creates a quantitative benchmark for onboarding redesign experiments.
Segmentation Strategy
Aggregated averages hide problems.
Segment onboarding metrics by acquisition channel, device type, geographic region, network condition, OS version, and user intent profile.
Paid users often activate differently than organic users. Low-end devices may show longer TTV due to performance bottlenecks. Without segmentation, optimization becomes guesswork.
Instrumentation Architecture
Reliable onboarding measurement requires structured event architecture.
Minimum required events:
- app_install
- first_open
- signup_started
- signup_completed
- onboarding_step_viewed
- activation_event
- session_start
- core_feature_used
- subscription_started
Each event must include timestamp, user identifier, app version, device metadata, acquisition source, and experiment variant if A/B testing.
Event naming consistency is non-negotiable. Poor event hygiene corrupts metric accuracy.
Experimentation Framework for Onboarding
Onboarding optimization requires disciplined experimentation.
When running A/B tests:
- Define activation event before experiment launch
- Measure downstream retention, not only immediate completion
- Run tests long enough to observe D7 or D14 retention shifts
- Avoid optimizing single screens without analyzing system impact
Onboarding experiments should prioritize activation velocity, not aesthetic preference.
Common Strategic Mistakes
Several systemic mistakes weaken onboarding measurement:
- Equating tutorial completion with activation
- Forcing full profile setup before value delivery
- Ignoring performance metrics
- Not linking onboarding metrics to monetization
- Running experiments without redefining activation criteria
Optimizing UI flow without optimizing value velocity produces shallow gains.
Industry Benchmarks (Directional Guidance)
While benchmarks vary by category, typical ranges are:
| Metric | General Range |
|---|---|
| Install to Signup | 60–80% |
| Signup to Activation | 40–60% |
| Day 1 Retention | 25–40% |
| Activated vs Non-Activated 30-Day Retention | 2x–4x difference |
Benchmarks should inform but not dictate strategy. Your product category, user intent, and value model define acceptable thresholds.
Strategic Perspective
Onboarding metrics are leading indicators of product-market alignment. Improvements in activation often outperform acquisition spend increases. A 10 percent improvement in activation can compound into significant LTV growth without increasing marketing budget.
Onboarding is where growth efficiency is determined. If activation is weak, no retention campaign can compensate. If TTV is long, performance optimization becomes essential. If engagement depth is shallow, monetization suffers.
The highest-leverage work in mobile growth often lies within the first session.
Closing Principle
Onboarding must be measured as a dynamic behavioral system. Activation defines value realization. TTV defines value velocity. Retention validates value sustainability. Revenue confirms value monetization.
Every metric discussed in this article exists to answer one question:
Did the user experience meaningful value fast enough to come back?
If you cannot answer that quantitatively, you are not measuring onboarding. You are observing it.