


TL;DR: Every mobile lead asks a vendor for their SDK size. Every vendor answers with a number, and that number almost never matches what actually lands in your binary, because it excludes transitive dependencies, varies by build configuration, and says nothing about cold start, memory, or network overhead once the SDK is actually initialising. This article covers why published SDK sizes are not comparable across vendors, a reproducible methodology for measuring the real cost yourself, what Google's own published data says about binary size and install conversion, how cold start is measured correctly at p50 and p95 rather than a misleading average, why the same overhead lands harder on the device tiers common in the Indian install base, the runtime costs beyond binary size that rarely get discussed, the concrete techniques that reduce measured overhead, and the specific questions to put to a vendor during a proof of concept. Sourcing note: Every statistic in this article is attributed to a real, independently published source, most of it directly from Android's own developer documentation and Google's own research. No vendor-specific SDK size, cold start, or memory figures are presented in this article as measured results, because that would require a controlled, hands-on benchmark this article does not claim to have run. Where this article recommends a methodology, it is a methodology for you to run, not a substitute for one already run on your behalf.
Ask a vendor for their SDK size and you will get a number within seconds. Ask what that number includes, and the conversation slows down considerably. This is not usually deception. It is a genuine measurement problem that most published figures simply do not solve, and the reason nobody publishes the full, honest cost is that the full, honest cost depends on your specific app, your build configuration, and your device mix in a way a single vendor-quoted number structurally cannot capture. This article does not pretend to have solved that problem for you with a table of measured competitor numbers. It gives you the real, sourced data on why the problem exists, and the exact methodology to answer it for your own app, which is the only version of this answer that is actually trustworthy.
Why the Published Numbers Are Not Comparable
A vendor-stated SDK size typically refers to the compiled size of the vendor's own artefact, the AAR on Android, the framework or XCFramework on iOS, before it is linked into your app and before Android's or iOS's own build tooling processes it. This number excludes several things that determine what actually lands in your shipped binary.
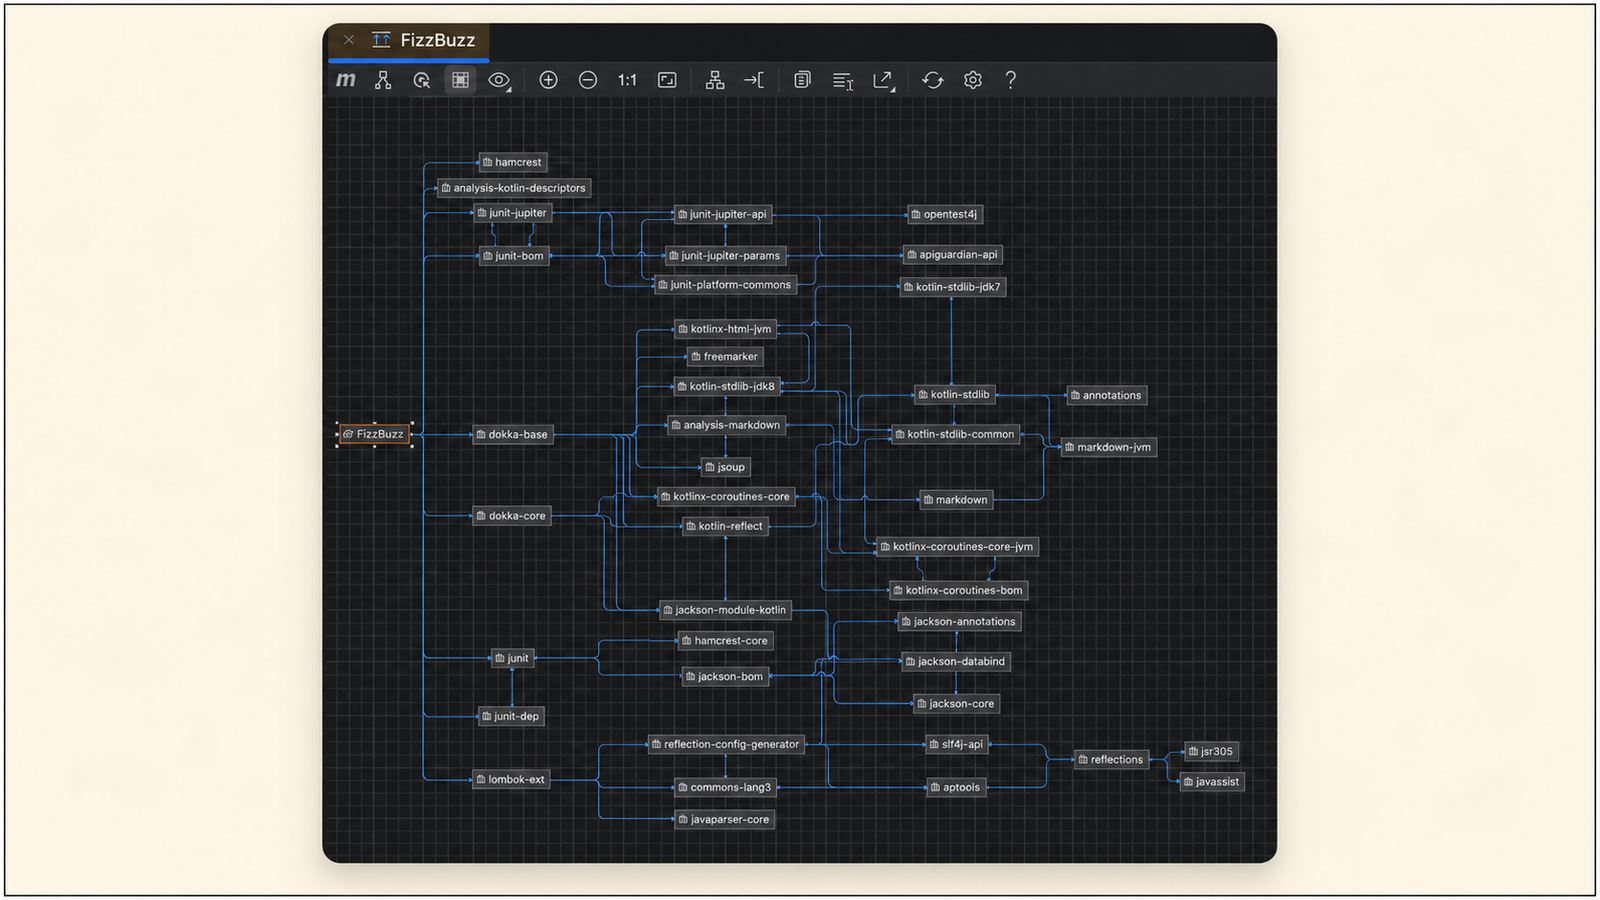
Transitive dependencies. If a vendor's SDK depends on a networking library, an image loading library, or a JSON parsing library that your app does not already include, those dependencies get pulled in at build time and added to your binary size, and this addition frequently does not appear in the vendor's own quoted figure at all, since that figure describes their own code, not the dependency tree their code requires.
Build configuration. Whether your app builds with ProGuard or R8 code shrinking enabled, whether you are shipping an Android App Bundle with per-device delivery or a universal APK, and whether resources are stripped of unused locales and densities, all materially change the final delta a given SDK contributes, and a vendor's single quoted number cannot account for build-configuration choices it has no visibility into.
Overlap with existing dependencies. If your app already includes a networking or analytics library that overlaps with what the SDK also bundles, the true marginal cost of adding the SDK can be smaller than its raw declared size, because some of what it needs is already present. Conversely, a conflicting version of a shared dependency can force a larger combined footprint than either library's own quoted size would suggest.
The honest consequence: a stated SDK size is a data point about the vendor's own artefact in isolation, not a prediction of what will happen to your specific binary. The only number that actually answers the question is the one you measure yourself, against your own app, which is the entire premise of the methodology in the next section.
The Measurement Methodology
A reproducible measurement requires holding every variable constant except the one you are testing, which is a discipline most informal SDK comparisons skip entirely.
Identical baseline app. Build a minimal but realistic app that mirrors your actual production configuration, same minimum SDK version, same target SDK version, same core dependencies your real app already carries, before adding any third-party in-app tool. This baseline is what every subsequent measurement is compared against.
Same build configuration for every test. Every SDK you evaluate should be added to the identical baseline, built in release mode with the same shrinking, obfuscation, and resource-stripping settings enabled, and packaged the same way, either always as an AAB or always as a universal APK, never mixed. A comparison between one SDK measured in debug mode and another measured in release mode is not a comparison at all.
Release mode specifically, not debug. Debug builds include debugging symbols, disable code shrinking, and behave differently at runtime in ways that do not reflect what a real user's device experiences. Any measurement taken in debug mode should be discarded for comparison purposes, since it systematically overstates size and understates the shrinking benefit a release build would actually apply.
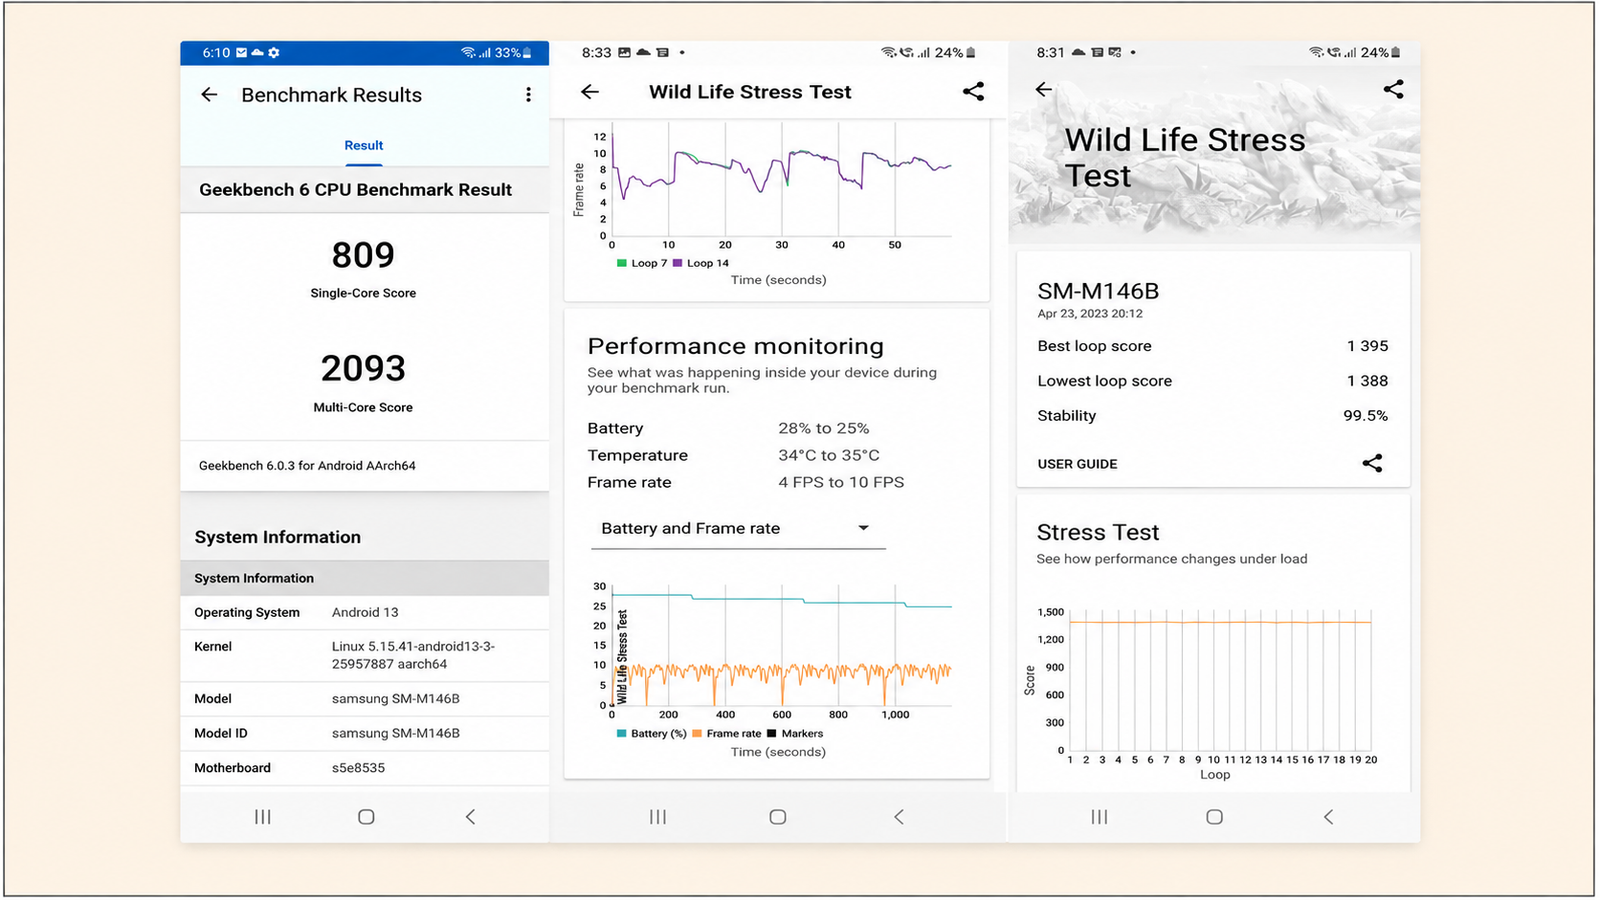
Real devices, not only emulators. A benchmark run in a clean lab environment, on a device that is plugged in, fully charged, and running only your app, measures potential performance, not actual performance, since a real user's device is rarely in any of those conditions. Include at least one genuinely low-end device in the target device class you actually serve, not only a current-generation flagship, since the delta between the two is frequently the entire point of the exercise.
Document every variable so the result is reproducible. Record the exact SDK version, the exact build tool versions, the exact device model and OS version, and the exact measurement tool used for each data point. A measurement that cannot be reproduced by someone else following the same steps is not a rigorous measurement, it is an anecdote with a number attached.
Binary Size Delta: What to Actually Measure
The specific artefact to compare is the final, shrunk, release-mode binary size delta between the baseline app and the baseline app plus the SDK, measured with and without the SDK's full transitive dependency tree included.
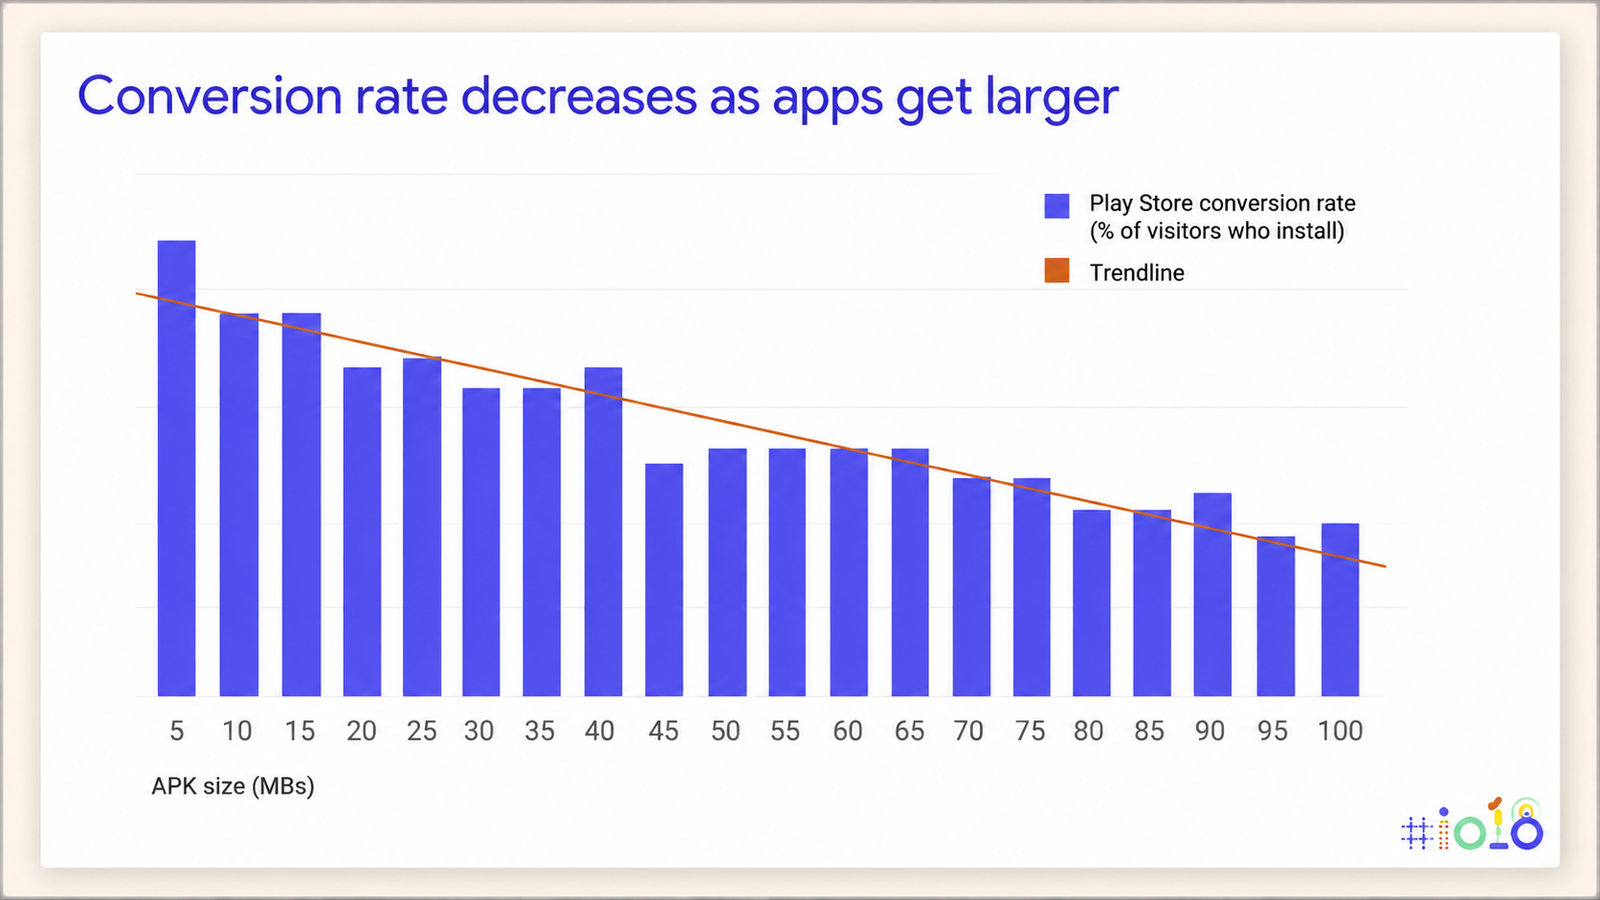
Android's own research is unambiguous about why this specific number matters beyond a purely technical curiosity: for every 6 MB increase in app size, install conversion rate decreases by approximately 1%, an effect that compounds as size increases further, with apps in the 50 to 100 MB range seeing meaningfully lower conversion than apps under 30 MB. The same Google Play research found that an app around 10MB completes downloads roughly 30% more often than an app around 100MB, and specifically flagged that this decline is not only users choosing not to install, but installs that fail to complete at all, for reasons including data cost concerns and available storage. Every SDK you add to your app is adding directly to the number this research describes, and the compounding effect means a handful of third-party SDKs, each individually modest, can collectively move an app across a conversion-relevant size threshold without any single addition looking alarming in isolation.
Measure the delta twice: once counting only the SDK's own declared artefact size, and once counting the full transitive dependency tree it pulls in. The gap between these two numbers is frequently where the real, unpublished cost lives, and it is the specific gap a vendor's own quoted figure is least likely to disclose.
Cold Start Impact: Measuring It Correctly
Android's own developer documentation defines specific, official thresholds for what counts as excessive startup time: a cold start taking 5 seconds or longer, a warm start taking 2 seconds or longer, and a hot start taking 1.5 seconds or longer, measured using time to initial display, the point at which the first frame is rendered. These thresholds exist because Google Play's own ranking algorithm factors this data in directly, meaning startup performance affects not just user experience but app discoverability.
Why the average is the wrong number to report. Cold start should be measured at both p50, the median user experience, and p95, the slow tail where user frustration and churn concentrate, because a healthy-looking median frequently conceals a genuinely bad experience for a meaningful share of real launches. A cold start with a median of 900 milliseconds but a p95 of 3.2 seconds means one in twenty launches takes over three seconds, which for an app with a million daily launches translates to fifty thousand genuinely bad experiences every single day, a reality the median alone completely hides.
How to measure it correctly. Android's official Macrobenchmark library provides a StartupTimingMetric specifically built to measure app startup accurately and reproducibly, distinct from manually timing a stopwatch against a launch, which introduces human reaction-time error into the measurement itself. Any SDK-attributable cold start delta should be measured using this or a comparable instrumented approach, with the same baseline-app methodology described earlier, comparing p50 and p95 cold start time with and without the SDK initialising during app launch specifically, not merely present in the binary.
The threshold worth holding a vendor to. One practitioner's more aggressive, real-world framing is worth taking seriously alongside Google's official 5-second "excessive" threshold: the actual competitor is not a vendor benchmark but user patience itself, which on mid-tier Android hardware runs out closer to 1.8 seconds. Google's 5-second figure is a hard floor below which Play Console actively penalises an app. It is not evidence that anything under 5 seconds is acceptable, and a vendor's SDK adding even a few hundred milliseconds to cold start deserves scrutiny against the tighter, real-world bar, not just the regulatory one.
Runtime Overhead Beyond Binary Size
Binary size and cold start are the two most commonly discussed costs. They are not the only ones, and the ones that go undiscussed are frequently more consequential to the actual user experience over time.
Memory footprint. An SDK's runtime memory allocation, measured while the app is active and again while backgrounded, matters specifically on lower-RAM devices, where an OS is more likely to aggressively terminate background processes to reclaim memory for whatever the user opens next. An SDK with a heavier persistent memory footprint increases the odds your own app is the one the OS kills first.
Background network calls. Any SDK making network requests outside a user-initiated action, periodic sync calls, telemetry pings, background event batching, consumes data and battery even when the user is not actively engaging with the feature the SDK provides. This should be measured directly, using a network traffic capture tool, comparing the baseline app's background network activity against the same app with the SDK integrated and idle.
Battery profile. Related to but distinct from background network activity, an SDK's CPU wake behaviour while the app is backgrounded contributes to battery drain independent of whether it is making network calls, since CPU wake-ups alone carry a measurable power cost.
Main-thread work during first render. Interprocess communications and unnecessary I/O occurring during the critical startup path can introduce lock contention, and any SDK initialisation code running synchronously on the main thread during app launch directly competes with your own app's first-render work for the same limited startup time budget. This is a specific, measurable contributor to cold start beyond the SDK's raw binary size, and it is worth isolating separately, since an SDK can have a modest binary footprint while still doing meaningfully expensive synchronous work at the exact moment your app is trying to render its first frame.
Why the Numbers Matter Differently by Market
The same measured overhead does not produce the same real-world consequence everywhere, and this is the specific reason the brief for this article points at the Indian install base by name.
Google's own research found that more than 50% of Indian and Indonesian Android smartphone users had no access to WiFi, meaning a large share of downloads are paid for directly on cellular data, and roughly 70% of people in emerging markets report considering an app's size before installing, specifically out of concern for data cost and available phone storage. This means the same 6MB-per-1%-conversion relationship Google measured globally is not evenly distributed. It concentrates its effect precisely in the markets where storage and data cost are live, daily constraints, not an abstract concern.
The device tiers where startup cost is felt most follow the same pattern. The practical recommendation from performance engineers working specifically in this market is direct: test on a genuinely representative low-end device, not a flagship, since a typical Tier 2 city user's device can be three to four generations behind current hardware, and cold start pain compounds correspondingly on that older hardware. A documented case from a fintech product in this market found that trimming cold start from 4.2 seconds to 1.6 seconds correlated with Day 7 retention improving from 11% to 19% within six weeks, with no other product change, purely a faster first frame. That is not proof any specific SDK addition caused a comparable effect, but it is a real, credible illustration of how much startup performance alone can move a retention number a team might otherwise attribute to something else entirely.
Reducing the Cost
Several concrete techniques reduce an SDK's measured overhead without requiring the vendor's own artefact to change at all.
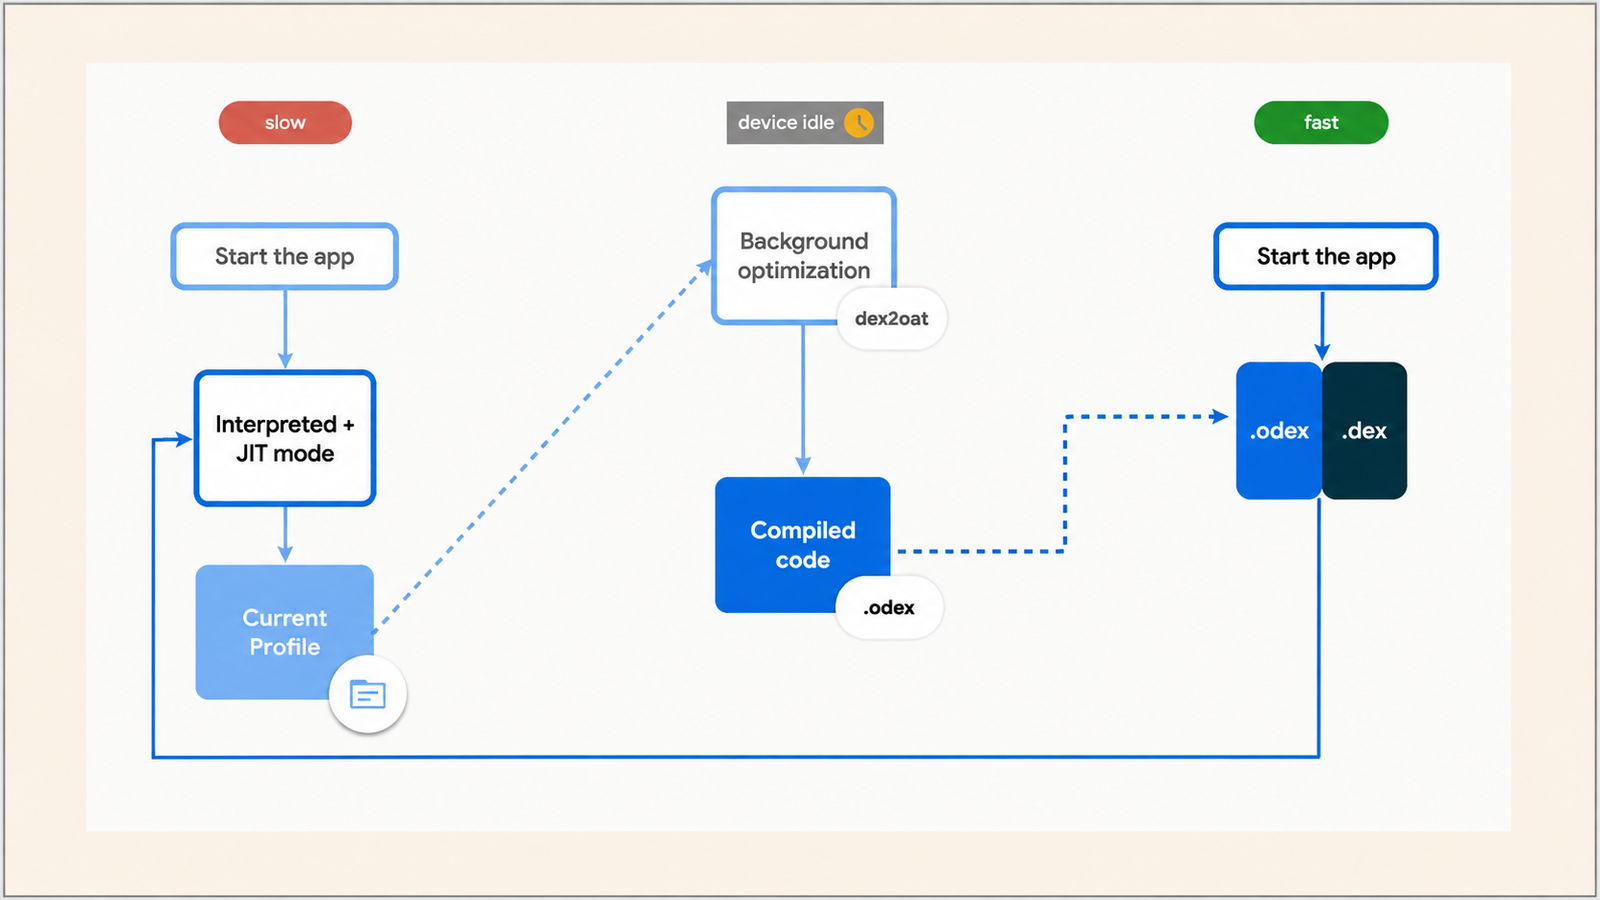
Lazy initialisation. Deferring an SDK's initialisation to a background thread, or triggering it only after the first interactive frame has already rendered, rather than initialising synchronously during app launch, removes that SDK's contribution to cold start entirely, since it is no longer competing for the startup critical path. Android's App Startup library specifically supports deferred providers for exactly this purpose, letting non-critical SDK initialisation happen after the app is already interactive rather than before.
Deferred SDK start. Beyond lazy initialisation of a single SDK, a broader discipline of only initialising a given SDK's full functionality once the specific feature it powers is actually needed, rather than eagerly starting every integrated SDK at app launch regardless of whether the current session will ever touch that feature, compounds the benefit across a stack with multiple third-party tools integrated simultaneously.
Trimming the dependency graph. Dependency injection graphs, such as those built with Dagger or Hilt, that eagerly construct every dependency at startup regardless of whether the current session needs them, impose a real and often underappreciated startup tax, and auditing which dependencies genuinely need to exist before first render, versus which can be constructed lazily on first actual use, is a direct lever independent of any single third-party SDK's own behaviour.
Official SplashScreen API over a custom splash activity. Using the platform's official SplashScreen API rather than a custom fake activity that adds a redundant render pass removes an entirely avoidable extra step from the startup sequence, a small but concrete fix that compounds with the larger structural changes above.
The Evaluation Questions
What to ask a vendor directly, what to measure yourself during a proof of concept, and the thresholds worth holding any vendor to, including the platform you already run.
What to ask the vendor. Request the SDK's declared size and its full transitive dependency list separately, not a single combined figure. Ask explicitly whether SDK initialisation runs synchronously on the main thread during app launch, or is deferred, and if deferred, by what specific mechanism. Ask for any published cold start delta the vendor has measured on their own reference hardware, and specifically what device class that reference hardware represents, since a figure measured only on current-generation flagships tells you little about your own low-end device tier. Ask whether the SDK makes any network calls independent of an explicit user or app action, and at what frequency.
What to measure yourself during a POC. Run the full baseline-app methodology described earlier, on your own actual app configuration, on at least one device representative of your real low-end tier, not only a test lab flagship. Measure binary size delta with and without transitive dependencies. Measure cold start at p50 and p95, with the SDK's initialisation active during launch. Measure background network activity and memory footprint while the app is idle with the SDK integrated. None of this requires exotic tooling: Android's own Macrobenchmark and Perfetto tools, and equivalent first-party profiling tools on iOS, are built specifically for this purpose and are available to any team without a specialised performance engineering function.
The thresholds worth holding a vendor to. A cold start delta from a single third-party SDK should be evaluated against a fraction of the total budget, not the full 5-second Play Console ceiling, since that ceiling is a floor for the entire app's startup time, not an allowance available to any one integrated tool in isolation. A binary size delta should be evaluated against Google's own 6MB-per-1%-conversion relationship directly: a vendor whose SDK, including its full dependency tree, adds several megabytes to your binary is asking you to accept a measurable, quantifiable conversion cost, and that cost should be weighed explicitly against the value the SDK provides, not accepted as an unavoidable rounding error.
Topics Not in the Brief That Teams Should Know
Vendor SDK size figures change between releases, and a POC measurement has a shelf life. A vendor's SDK footprint measured today during a proof of concept is not guaranteed to remain constant across future SDK updates, and a contract or integration decision made purely on an initial measurement should include an ongoing monitoring practice, re-running the same baseline comparison after any major SDK version upgrade, rather than treating the original POC number as a permanent fact.
Multiple third-party SDKs interact, and their combined cost is not simply additive. Two SDKs each individually well-behaved can produce a worse combined result than either alone, through dependency version conflicts, competing background network schedulers, or shared resource contention during startup. A team integrating several in-app or analytics tools simultaneously should measure the full stack together, not just each SDK's isolated delta against a clean baseline, since the isolated numbers can each look acceptable while the combined reality does not.
iOS measurement requires its own equivalent discipline, not a direct translation of Android's tooling. Apple's own performance measurement tooling, accessible through Xcode's Organizer and App Store Connect, includes comparable metrics such as Hang Rate, the percentage of sessions containing a main-thread hang longer than 250 milliseconds, and any team evaluating an SDK's cost across both platforms needs a parallel, platform-appropriate methodology for iOS rather than assuming an Android measurement transfers directly.
Server-driven rendering architectures shift where the cost actually lives, which is worth understanding before comparing SDK sizes at face value. A tool that renders in-app content natively without a WebView bridge carries a different binary and runtime cost profile than one that ships a WebView-based rendering engine as part of its SDK, and a raw size comparison between the two, without accounting for what each architecture is actually doing at runtime, can produce a misleading conclusion about which one is genuinely lighter in practice.
Key Takeaways
- A vendor's published SDK size describes their own artefact in isolation, not what actually lands in your binary, since transitive dependencies, your build configuration, and overlap with your app's existing dependencies all change the real delta in ways a single quoted number cannot capture.
- A reproducible measurement requires an identical baseline app, consistent release-mode build configuration across every SDK tested, and real devices including a genuinely low-end one, not only a flagship or an emulator.
- Google's own research found a direct relationship between app size and install conversion, roughly 1% conversion lost per 6MB added, with the effect compounding at larger sizes and hitting harder in markets where data cost and storage are live daily constraints.
- Cold start should always be reported at p50 and p95 together, never as a single average, since a healthy median can conceal a genuinely bad experience for a meaningful share of real launches, exactly where user frustration and churn concentrate.
- Runtime overhead beyond binary size and cold start, memory footprint, background network calls, battery profile, and main-thread work during first render, are real, measurable costs that most SDK evaluations skip entirely despite being frequently more consequential to actual user experience over time.
- The same measured overhead lands harder on lower-end device tiers common in markets like India, where users are three to four hardware generations behind a current flagship, which is why testing exclusively on lab-grade or flagship devices systematically understates the real-world cost.
- Lazy initialisation, deferred SDK start, Baseline Profiles, trimmed dependency graphs, and the official SplashScreen API are concrete, available techniques that reduce measured overhead without requiring any vendor to change their own artefact.
- The right evaluation approach asks a vendor for a disaggregated size and dependency list rather than a single figure, and independently measures the full stack, not each SDK in isolation, during your own proof of concept before signing anything.
Further Reading
From Digia
- Inline Banners vs Overlays: Conversion Impact and UX Friction — the companion measurement-discipline piece in this series, applying the same commitment to sourced, honestly-scoped data to a different comparison question
- No-Code In-App Campaigns: How Growth Teams Ship Without Developers — the native, WebView-free rendering architecture relevant to the runtime cost profile comparison in this article's additional topics
- CleverTap Alternatives: 7 Tools for Teams Who Want Better In-App UI — the broader vendor evaluation framework this article's evaluation questions section extends with a performance-specific lens
- Why Indian Product Teams Need Different In-App Tooling Than US SaaS — the device and network reality data this article's market-sensitivity section draws on directly
- Digia Engage — a native, non-WebView rendering architecture designed around the SDK footprint and cold start constraints this article documents
External Sources — All Claims Attributed
- App startup time, Android Developers — Android Developers (official cold, warm, and hot startup thresholds; time to initial display methodology)
- Overview of measuring app performance, Android Developers — Android Developers (p95/p99 methodology; main-thread I/O contention during startup)
- Android Developers Blog: Leveling Guide for Your Performance Journey — Android Developers (Macrobenchmark, StartupTimingMetric, and Perfetto as official measurement tooling)
- Shrinking APKs, Growing Installs — Google Play Apps & Games, Sam Tolomei (the original 6MB-per-1%-conversion research; the 30% download completion gap; emerging-market WiFi access and size-sensitivity data)
- What is App Size? Limits and Optimization — Adapty (app size conversion impact restated with current context)
- How to Measure Mobile App Performance: Top 18 Metrics 2026 — UXCam (p50/p95 cold start measurement framing; payload and cache-rate benchmarks)
- I Spent 3 Years Getting Mobile Performance Wrong — Medium, Neeshu Kumar (the p95-hides-the-tail illustration; lab benchmark versus real user monitoring distinction; iOS Hang Rate metric)
- App Cold Start Time: Fix Slow Launch & Boost Retention — RS999 (lazy initialisation, Baseline Profiles, dependency graph trimming techniques; the fintech cold-start-to-retention case data; India-specific device tier guidance)
This article is part of Digia's Engagement and Lifecycle series.
Evaluating an in-app tool's real cost to your app before you integrate it? Digia Engage renders natively without a WebView bridge, built specifically around the SDK footprint and startup constraints this article documents. Book a demo to walk through the architecture, or measure it yourself using the methodology in this article during a scoped proof of concept.